DISCRIMINATION IN THE EU IN 2015
|
|
|
- Gotthilf Lange
- vor 6 Jahren
- Abrufe
Transkript
 and")

1 Special Eurobarometer 7 DISCRIMINATION IN THE EU IN 015 REPORT Fieldwork: May - June 015 Publication: October 015 This survey has been requested by the European Commission, European Commission, Directorate- General for Justice and Consumers (DG JUST) and co-ordinated by the Directorate-General for Communication. This document does not represent the point of view of the European Commission. The interpretations and opinions contained in it are solely those of the authors.
2 Project title Linguistic Version Catalogue Number Special Eurobarometer 7 Discrimination in the EU in 015 EN DS EN-N ISBN DOI 10.88/9976 European Union, 015
3 Special Eurobarometer 7 Discrimination in the EU in 015 Conducted by TNS Opinion & Social at the request of the Directorate-General for Justice and Consumers (DG JUST) Survey co-ordinated by the Directorate-General for Communication (DG COMM Strategy, Corporate Communication Actions and Eurobarometer Unit) 1
4 TABLE OF CONTENTS INTRODUCTION... MAIN FINDINGS SETTING THE CONTEXT Belonging to a group at risk of discrimination THE PERCEPTION OF AND ATTITUDES TOWARD DISCRIMINATION IN THE EU In general Ethnic origin Age discrimination against older people Age discrimination against younger people Religion/belief Disability Gender Diversity in the media.... SPOTLIGHT ON ATTITUDES TOWARDS LGBT PEOPLE Sexual orientation Gender identity EXPERIENCE OF DISCRIMINATION AND KNOWLEDGE OF THE LAW Personal experience of discrimination Knowledge of victims rights in the event of discrimination Where would Europeans prefer to report harassment or discrimination VIEWS ABOUT EQUAL OPPORTUNITIES IN EMPLOYMENT Factors that are perceived to put applicants for a job at a disadvantage Support for measures to foster diversity in the workplace Perception as to whether enough is being done to promote diversity in the workplace... 8
5 6. MEASURES AND POLICIES TO FIGHT DISCRIMINATION The perceived effectiveness of national efforts to fight discrimination Is there a need for new measures to fight discrimination? Are some groups excluded from measures and policies to fight the crisis? The willingness to provide sensitive personal information Should school lessons and material include information about diversity? CONCLUSIONS ANNEXES Technical specifications Questionnaire Result tables
6 INTRODUCTION This report presents the results from a new Eurobarometer survey on discrimination. It was commissioned by the Directorate-General for Justice and Consumers (DG JUST) and coordinated by the Directorate-General for Communication (DG COMM), and it has been carried out by TNS Opinion & Social network. Background European anti-discrimination legislation is among the most extensive in the world. In 000, the European Union adopted two far-reaching laws 1 to prohibit discrimination in the workplace based on racial or ethnic origin, religion or belief, disability, age, or sexual orientation. As far as racial and ethnic origin is concerned, this legislation extends to other aspects of daily life, such as education and social services. These texts come in addition to numerous laws that have been adopted at EU level since 1975 to promote equality between women and men in the workplace. From the policy side, the European Commission published in 008 the Communication Non discrimination and equal opportunities: a renewed commitment and several Communications on the integration of the Roma population in the EU, most recently in 015. The EU s objectives in fighting discrimination are to: Improve knowledge of discrimination by raising awareness among the population of their rights and obligations and also of the benefits of diversity; Support intermediary actors such as NGOs, social partners and equality bodies to improve their capacity to combat discrimination; Support the development of equality policies at national level and encourage the exchange of good practices between EU countries; Achieve real change in the area of anti-discrimination through training activities; Push for business-oriented diversity management as part of a strategic response to a more diversified society, customer base, market structure and workforce. 1 Directive 000//EC of 9 June 000 and Directive 000/78/EC of 7 November 000. Both directives are based on Article 1 of the Amsterdam Treaty establishing the European Community which reads: "the Council, acting unanimously on a proposal from the Commission and after consulting the European Parliament, may take appropriate action to combat discrimination based on gender, racial or ethnic origin, religion or belief, disability, age or sexual orientation". For more information, please see
7 Content Three previous Eurobarometer surveys examining discrimination have been conducted in the past: in 006 5, and The 015 survey repeats several questions asked in previous years in order to provide insight into the evolution of perceptions, attitudes, knowledge and awareness of discrimination in the European Union. A number of new questions have been added to further explore social acceptance of some groups at risk of discrimination. The report is structured as follows: Setting the context, including whether citizens think of themselves as belonging to a group at risk of discrimination and the diversity of their social circles; Perceptions of discrimination, covering the perceived extent of discrimination in respondents countries, personal attitudes toward different groups at risk of discrimination and representations of diversity in the media; Spotlight on attitudes towards LGBT (lesbian, gay, bisexual and transgender) people, covering public attitudes towards sexual orientation and gender identity; Experience of discrimination and knowledge of the law; Views about equal opportunities in employment; Measures and policies to fight discrimination, including willingness to provide sensitive personal information and attitudes towards diversity information being provided at school
8 This survey was carried out by TNS Opinion & Social network in the 8 Member States of the European Union between 0 May and 8 June 015. Some 7,718 respondents from different social and demographic groups were interviewed face-to-face at home in their mother tongue on behalf of Directorate-General for Justice and Consumers. The methodology used is that of Eurobarometer surveys as carried out by the Directorate- General for Communication ( Strategy, Corporate Communication Actions and Eurobarometer Unit) 8.. A technical note concerning the interviews conducted by the member institutes of the TNS Opinion & Social network is annexed to this report. It also specifies the interview methods and the confidence intervals 9. Note: In this report, countries are referred to by their official abbreviation. The abbreviations used in this report correspond to: ABBREVIATIONS BE Belgium LV Latvia CZ Czech Republic LU Luxembourg BG Bulgaria HU Hungary Denmark MT Malta DE Germany NL The Netherlands EE Estonia AT Austria EL Greece PL Poland ES Spain PT Portugal FR France RO Romania HR Croatia SI Slovenia IE Ireland SK Slovakia IT Italy FI Finland CY Republic of Cyprus* SE Sweden LT Lithuania UK United Kingdom EU8 Euro area European Union weighted average for the 8 Member States BE, FR, IT, LU, DE, AT, ES, PT, IE, NL, FI, EL, EE, SI, CY, MT, SK, LV, LT Non euro area BG, CZ,, HR, HU, PL, RO, SE, UK * Cyprus as a whole is one of the 8 European Union Member States. However, the acquis communautaire has been suspended in the part of the country which is not controlled by the government of the Republic of Cyprus. For practical reasons, only the interviews carried out in the part of the country controlled by the government of the Republic of Cyprus are included in the CY category and in the EU8 average. * * * * * We wish to thank the people throughout the European Union who have given their time to take part in this survey. Without their active participation, this study would not have been possible The results tables are included in the annex. It should be noted that the total of the percentages in the tables of this report may exceed 100 when the respondent has the possibility of giving several answers to the question. 6
9 MAIN FINDINGS Setting the context The social circles of Europeans are steadily becoming more diverse. An increasing proportion of respondents have friends or acquaintances that belong to most groups at risk of discrimination, ranging from 70 having friends belonging to a different religion or with different beliefs (+ percentage points since June 01) to 9 having friends who are transgender or transsexual (+). The proportion who have Roma friends or acquaintances has remained stable. Around one in eight respondents (1) consider themselves part of a group at risk of discrimination: 5 consider themselves being part of a religious minority, of an ethnic minority, of a minority in terms of disability, of a minority with regards to sexual orientation and from any other group at risk of discrimination. Perception of discrimination in the EU Discrimination on the grounds of ethnic origin continues to be regarded as the most widespread form of discrimination in the EU (6), followed by discrimination on the basis of sexual orientation (58), gender identity (56), religion or belief (50), disability (50), age (being over 55 years old, ) and gender (7). The proportion of respondents that think discrimination is widespread has generally increased since 01, especially for the grounds of sexual orientation (+1), gender identity (+11) and religion or beliefs (+11). For discrimination on the grounds of being over 55 years old, a decrease of respondents believe this to be widespread (-). Attitudes towards groups at risk of discrimination Europeans are becoming increasingly more comfortable with the possibility of electing someone to the highest political position from a group at risk of discrimination. The proportions of respondents at ease 10 with the election of a member of a group at risk of discrimination to the highest political position vary from 9 for a woman (+7 percentage points from 01), to 5 for a transgender or transsexual person (+10). Most respondents say they would be at ease if one of their work colleagues belonged to a group at risk of discrimination; 87 say they would be comfortable or indifferent in relation to a person with disabilities, although the proportions are 10 The term at ease means that respondents are either comfortable (codes 7 to 10 on the 10-point scale of comfortability), or indifferent (spontaneous answer): the proportion of at ease regroup the two answers comfortable and indifferent. It will be used throughout the survey to make a clear distinction with the total comfortable. 7
10 lower for other groups: a Roma person (6), a transgender or transsexual person (67), or a Muslim person (71). Respondents are generally less at ease with the possibility of one of their sons or daughters having a relationship with someone from a group at risk of discrimination. Less than half of respondents would be comfortable or indifferent if their son or daughter had a relationship with a Roma person (5) or a transgender or transsexual person (8). The majority of respondents express tolerant or supportive views in relation to gay, lesbian and bisexual people having the same rights as heterosexual people (71 agree) and with regards to same sex marriages being allowed throughout Europe (61 agree). This latter opinion has increased steeply since 006, when just agreed that homosexual marriages should be allowed throughout Europe. Most respondents also believe that transgender or transsexual persons should be able to change their civil documents to match their inner gender identity (6). Most respondents think that diversity is sufficiently reflected in the media, in terms of gender (7) and young people aged under 5 (66). However, this is less likely to be the case for other groups at risk of discrimination, such as people with disabilities (5), people aged over 75 (50) and gender identity (1). Experience of discrimination and knowledge of the law Around a fifth of respondents (1) report that they have personally experienced discrimination or harassment in the previous 1 months: 16 have experienced discrimination on the basis of one of the grounds analysed in the survey, and 5 on multiple grounds. Respondents who describe themselves as being part of a minority in terms of disability (7) and those who say they belong to a minority with regards to sexual orientation () or to an ethnic minority (0) are most likely to say they have experienced discrimination. Just under half of respondents (5) say they would know their rights should they fall victim to discrimination or harassment, an increase from the 01 survey (+8 percentage points). Equal opportunities in employment Many Europeans perceive that discrimination exists in recruitment practices. Over half (56) believe that a job applicant s age, if over 55, would be a disadvantage. This is followed by a candidate s look, manner of dress or presentation (5), skin colour or ethnic origin (6), a disability (6) and the candidate s general physical appearance (5). 8
11 There is widespread support for measures in the workplace to foster diversity, such as training on diversity issues (80), monitoring of recruitment procedures (77), and monitoring the composition of the workforce (69). Most European workers feel that enough is being done to promote diversity in their workplace for young people (58) and in terms of gender (58). However, respondents are less likely to think that enough is being done in relation to other characteristics, in particular sexual orientation () and gender identity (). Measures and policies to fight discrimination There are mixed views on the effectiveness of national efforts to fight discrimination: 7 believe that efforts are effective, 6 say they are moderately effective and 6 ineffective. Views have become more positive since the 01 survey, with an increase in the proportion saying efforts are effective (+5 percentage points). The majority of respondents (6) say that new measures should be introduced to raise the level of protection for groups at risk of discrimination, while 7 think that new measures are not necessary. Respondents are most likely to think that measures to fight the economic crisis and policies to promote recovery in their country are excluding people over 55 years old (5) and people with a disability (6). They are less likely to think that other groups are being excluded. Respondents express support for providing personal details on an anonymous basis, if that could help to combat discrimination in their country. This applies to information on their ethnic origin (7 in favour), their religion or beliefs (71), their health situation (66) and their sexual orientation (6). Most respondents agree that school lessons and material should include information about diversity, particularly in terms of ethnic origin (81 agree) and religion or beliefs (80) Important variations between countries Opinions on discrimination and towards the different groups at risk of discrimination differ quite importantly among EU Member States, as result of national specificities such as prevalence of different groups at risk of discrimination, cultural and historical considerations and/or recent political and legal developments relevant for each group. The polarisation of attitudes among countries is particularly high when it comes to opinions and perceptions on LGBT people. 9
12 1. SETTING THE CONTEXT This chapter provides some background to the topic of discrimination. We first look at the extent of diversity in people s social networks and then see to what level Europeans see themselves as belonging to a group at risk of discrimination Belonging to a group at risk of discrimination Although just one in eight respondents consider themselves part of a group at risk of discrimination, their social circles continue to get more diverse Attitudes towards discrimination can be strongly influenced by whether people have friends or acquaintances from various groups at risk of discrimination. As we will see throughout the report, this is a factor with considerable impact on attitudes to opinions and attitudes towards discrimination. The results of this Eurobarometer survey reveal that the social circles of Europeans are steadily becoming more diverse: seven in ten respondents have friends or acquaintances who are of a different religion or have different beliefs than themselves (70; + percentage points since June 01) and almost two in three have friends or acquaintances who have disabilities (6; +1) or of a different ethnic origin from their own (6; +). It is slightly less common for respondents to have gay, lesbian or bisexual friends or acquaintances (7), although this is now more common than in June 01 (+6), and a minority of respondents have Roma friends or acquaintances (18; no change) or have transgender or transsexual friends or acquaintances (9; +) 11. Respondents were read a definition of transgender and transsexual 1. Overall, these findings show a continuing increase in the diversity of respondents social networks. 11 SD1: Do you have friends or acquaintances who are? 1) People whose ethnic origin is different from yours ) Roma ) Gay, lesbian or bisexual ) Disabled 5) Of a different religion or have different beliefs than you 7) Transgender or transsexual. 1 : Gender identity refers to each person s deeply felt internal and individual experience of gender, which may or may not correspond with the sex assigned at birth. Transgender and transsexual are people whose gender identity differs from the sex they were assigned at birth. This has legal implications as well: for example, a transgender or transsexual person with a female gender identity would seek to change her civil documents (passport, ID, driving license, etc.) from male to female to match how she lives her everyday life. 10

13 There is wide variation between countries: more than half of respondents in Romania (55) say that they have friends or acquaintances who are Roma 1. By contrast, in nine countries the proportion is less than 10. More generally, 85 of respondents in Estonia and Sweden report having friends or acquaintances whose ethnic origin is different from theirs, while this falls to just over one in five in Poland (1). Similarly, respondents in Poland (9) are least likely to say they have friends with a different religion or beliefs, while almost nine in ten (89) in the United Kingdom report this. Looking at diversity in terms of sexual orientation and gender identity, more than eight out of ten respondents in the Netherlands say they have gay, lesbian or bisexual friends or acquaintances (8), but just 6 of respondents in Romania say the same. Over one in five respondents () in Malta report having transgender or transsexual persons in their social circle; however, in ten Member States, this proportion is below 5. Finally, over three in four respondents in Lithuania say they have friends or acquaintances who have disabilities. Indeed, at least half of respondents say this in 5 Member States, and the lowest proportion is found in Greece (). There are clear differences in the findings depending on people s socio-demographic characteristics. Across all types of friends or acquaintance included in the survey, the main socio-demographic variations are as follows: younger respondents, those with longer full-time education, and those in urban areas are more likely to have a diverse group of friends or acquaintances. With regards to self-identification as a minority, 1 of European citizens consider themselves part of a group at risk of discrimination, including 5 who say they are part of a religious minority and who are from an ethnic minority, who say they 1 According to Council of Europe estimates, there are some six million Roma in the European Union, of whom close to two million are estimated to live in Romania. 11
14 are part of a minority in terms of disability, from a minority with regards to sexual orientation and from any other group at risk of discrimination 1. These findings are very similar to those observed in the previous survey in June 01. The proportion that considers themselves part of any group at risk of discrimination does not vary much across different Member States. It is highest in the United Kingdom (, with a high proportion saying they are part of an ethnic or religious minority) and lowest in Greece (5) and Cyprus (7). 1 SD: Where you live, do you consider yourself to be part of any of the following? Please tell me all that apply. 1
15 . THE PERCEPTION OF AND ATTITUDES TOWARDS DISCRIMINATION IN THE EU This section examines respondents perceptions of whether discrimination is widespread and then asks respondents about their own perceptions; specifically, respondents were asked how comfortable they would be with different scenarios relating to groups at risk of discrimination (e.g. whether they would be comfortable with having a person from a group at risk of discrimination in the highest elected position in their country). Finally, the section considers whether diversity is sufficiently reflected in the media. Section.1 covers perceptions of different forms of discrimination; then sections..7 focus on attitudes towards each of a number of groups at risk of discrimination in turn. Section.8 looks at diversity in the media across all groups at risk of discrimination..1. In general This section examines how widespread Europeans think discrimination is in their country, in relation to various groups at risk of discrimination. Respondents were read a definition for discrimination and harassment 15. It is important to bear in mind that the findings reflect respondents perceptions of discrimination of their country, rather than the prevalence of discrimination in reality; thus, these perceptions are likely to vary according to personal knowledge and experience. Discrimination on various grounds is seen as more widespread than was the case in 01 Discrimination on the grounds of ethnic origin continues to be regarded as the most widespread form of discrimination in the EU (6), and it is more likely to be seen as widespread than was the case in 01 (+8 percentage points). More than half of respondents in the European Union say that discrimination is widespread in their country on the basis of sexual orientation (58; +1) and gender identity (56; +11), both showing substantial increases from the 01 survey. The proportion saying discrimination on the basis of religion or belief is widespread has also increased substantially, from 9 in 01 up to 50 in 015, while there has been a smaller increase in relation to discrimination on the basis of disability (50; +). Over one in three respondents say that discrimination on the basis of gender is widespread in their country (7; +6 percentage points). Respondents are more likely to say that age discrimination is widespread on the basis of being over 55 years old (; -) rather than being under 0 years olds (19; +1) Discrimination is understood to mean when a person or group is treated less favourably than others because of personal characteristics. Harassment is commonly understood to arise when unwanted behaviour takes place with the purpose or effect of violating the dignity of a person and of creating a hostile, degrading, humiliating or offensive environment. 16 QC1: For each of the following types of discrimination, could you please tell me whether, in your opinion, it is very widespread, fairly widespread, fairly rare or very rare in (OUR COUNTRY)? Discrimination on the basis of 1
 and gender (9).")
16 Respondents could also answer spontaneously that they consider a particular type of discrimination to be non-existent in their country. Respondents are most likely to say that discrimination is non-existent on the grounds of age (18 in relation to being under 0 years old and 8 in relation to being over 55) and gender (9). It is important to see these results in the context of the survey findings as a whole. As we will see throughout the report, more Europeans report to be more tolerant of groups at risk of discrimination and also to be better informed about their rights in case of discrimination compared with the Eurobarometer survey conducted in 01. Therefore, the perception that discrimination is more widespread could reflect a greater awareness about discrimination as much as an actual rise in cases of discrimination. Analysis by country shows the following patterns: Respondents in France are particularly likely to say that discrimination is widespread in their country on a number of grounds: ethnic origin (8), religion or beliefs (76), sexual orientation (7), disability (69) and gender (5).. The proportion of respondents that say discrimination is widespread on the basis of sexual orientation and gender identity is high in Cyprus (79 for both), Italy (7 for sexual orientation and 71 for gender identity) and Greece (70 and 7). Respondents in Romania are most likely to see age discrimination as widespread in relation to both those aged over 55 (56) and those aged under 0 (). 1) Ethnic origin ) sexual orientation (being gay, lesbian or bisexual) ) Being over 55 years olds ) Being under 0 years old 5) Religion or beliefs 6) Disability 7) Gender identity (being transgender or transsexual) 8) Gender. 1
17 In several countries, most respondents say that discrimination is rare, on a number of grounds: o Latvia, on the basis of ethnic origin (), religion (1), gender (19), sexual orientation (5) and gender identity (1); o o o Estonia, on the basis of ethnic origin (1), religion (18) and gender identity (); Poland, on the basis of ethnic origin (1), disability (9) and gender (19); Slovakia, on the basis of ethnic origin (6), religion (15) and sexual orientation (8); o Luxembourg, on the basis of disability (1), sexual orientation (8) and of being over 55 (6). In the Czech Republic and Bulgaria, respondents are particularly likely to say that discrimination against people aged over 55 is widespread (58 and 57, respectively). However, they are less likely to see widespread discrimination on other grounds. In the Czech Republic, low proportions say that discrimination is widespread on the basis of religion or beliefs, sexual orientation and gender identity. In Bulgaria, low proportions say that discrimination is widespread on the basis of gender and sexual orientation. In Denmark, respondents are likely to say that discrimination on the grounds of ethnic origin (78) is widespread, but are unlikely to say that age or gender discrimination is widespread in their country. 15

18 16
19 Turning to socio-demographic variations: Women are more likely than men to say that discrimination is widespread in their country. This applies not only to gender discrimination (0 of women say this is widespread, compared with of men), but also to other forms of discrimination as well. The difference is greatest in relation to disability discrimination (5 of women compared with 6 of men). Older people are less likely to say that various forms of discrimination are widespread. The difference is most pronounced in relation to gender identity (9 of those aged 55 or over say this is widespread, compared with 65 of those aged 15-). The one exception is discrimination against those aged over 55: younger people aged 15- are less likely to say this is widespread (), although the figure for those aged 55 or over () is similar to those for the 5-9 and 0-5 age groups (1 and 5 respectively). Respondents who stayed at school the longer are slightly more likely to say that discrimination is widespread, on the basis of gender, ethnic origin, religion or beliefs, and gender identity. Respondents are more likely to say that discrimination is widespread if they are members of the group at risk of discrimination in question. The difference is greatest in relation to disability: 70 of those who have disabilities themselves say that disability discrimination is widespread, compared with 50 of respondents overall. However, answers are also influenced by whether respondents are members of any group at risk of discrimination. For example, the proportion of respondents who say that discrimination on the grounds of religion or beliefs is widespread is higher than average among respondents who are from a minority with regards to sexual orientation (6) or other group at risk of discrimination (6). This suggests that being part of a group at risk of discrimination might increase awareness of the presence of discrimination, both in relation to their own and other groups at risk of discrimination. Similarly, respondents are more likely to say that discrimination is widespread if they have experienced discrimination themselves, although this is not limited to the type of discrimination in question. In particular, respondents who have experienced discrimination on multiple grounds are more likely to see various types of discrimination as widespread. People who have friends or acquaintances who belong to a group at risk of discrimination are more likely to say that discrimination is widespread. Once again, this applies not just to respondents who have friends or acquaintances belonging to the group in question, but more broadly to those who have a diverse social circle. 17

20 18
21 .. Ethnic origin Europeans are becoming more comfortable with the possibility of having a head of state from an ethnic minority group..1. Having a person from a different ethnic origin in the highest political office Firstly, we examine attitudes to ethnic diversity as measured by how comfortable Europeans would be if someone of a different ethnic origin from the majority of the population were appointed to the highest elected political position in their country. As with all of the questions in this section, respondents answered using a 10-point scale (where 1 means totally uncomfortable and 10 means totally comfortable). For analysis purposes, these responses have been combined into three categories: comfortable (score of 7-10 out of 10), moderately comfortable (score of 5 or 6) and uncomfortable (score of less than 5). In addition, some respondents answered spontaneously that they were indifferent, which can be taken as a positive response indicating that the respondent is relaxed and tolerant about issues relating to the group at risk of discrimination in question. In much of the analysis, including the trend comparisons with the previous survey, we have combined the comfortable and indifferent responses to give a proportion that are either comfortable or relaxed about the issue in question: we then used the term at ease to describe the combination of these two answers. Across the EU as a whole, close to two-thirds of respondents (6) say that they would be at ease if someone of a different ethnic origin from the majority of the population were appointed to the highest elected political position in their country (combining the comfortable (55) and indifferent responses (9)); 18 would be uncomfortable with this 17. There has been an increase from the 01 survey from 5 up to 6: respondents are now more comfortable with the possibility of electing someone to the highest political position from an ethnic minority than they were three years ago. The figures for the EU as a whole conceal wide variations at the national level. In five countries, at least three-quarters of respondents say they would be comfortable or indifferent about having someone from an ethnic minority in the highest elected political position: Sweden (8), Spain (80), Ireland (78), the United Kingdom (77) and the Netherlands (75). Conversely, only a small proportion of respondents say they would be comfortable or indifferent in the Czech Republic (6), with low proportions also seen in Bulgaria (8), Cyprus (8) and Slovakia (9). 17 QC: And using a scale from 1 to 10, please tell me how you would feel about having a person from each of the following groups in the highest elected political position in (OUR COUNTRY). '1' means that you would feel "not at all comfortable" and '10' that you would feel "totally comfortable". ) A person from a different ethnic origin than the majority of the population. 19
22 A comparison with the 01 results indicates that comfort levels are now higher in Member States. The largest increases in the proportion comfortable or indifferent are recorded in Hungary (+ percentage points), Austria (+18) and Belgium (+18). The only countries where there has been a decrease are Bulgaria (-5), Poland (-) and Denmark (-1). The proportion of respondents who would be at ease if someone of a different ethnic origin from the majority of the population were appointed to the highest elected political position has remained stable in the Czech Republic. * NA= Not asked: this question was not asked in this country during the previous survey 0
23 Socio-demographic analysis shows that younger people are more at ease with having a person from an ethnic minority in the highest elected political office (7 of 15- year olds are comfortable or indifferent, falling to 57 among those aged 55 or over). Comfort levels (those comfortable or indifferent) are also higher among those who left education at a later stage (7 among those who finished their full-time education at the age of 0 or older, falling to 56 among those who ended education by the age of 15). Respondents who are from an ethnic minority themselves are more likely to be comfortable or indifferent about the possibility of having a person from an ethnic minority in the highest elected political office (76). Comfort levels are also higher among those who have friends or acquaintances from a different ethnic origin (7), as well as those who have friends or acquaintances from other groups at risk of discrimination (for example 7 of those with friends or acquaintances who are gay, lesbian or bisexual say they would be comfortable or indifferent). This suggests that having a more diverse social circle tends to increase people s tolerance towards different groups at risk of discrimination.... Working with a Roma, black, Asian or white person All respondents were asked, regardless of whether they were actually working or not, how comfortable they would feel if one of their colleagues at work belonged to various ethnic groups 18. Across the EU as a whole, a large majority of respondents say they would be at ease working with a white person (9), including 11 saying they are indifferent ; just say they would be moderately comfortable or uncomfortable. However, the proportions that are comfortable or indifferent are lower in relation to working with a black or Asian person (8 in each case), and lower still for working with a Roma person (6). In particular, 0 of respondents say they would be uncomfortable working with a Roma person; this compares with 6 for working with either a black or Asian person and 1 for working with a white person. Country analysis indicates that respondents in the following countries are most at ease with the possibility of working with a black person: Sweden (97 comfortable or indifferent), Denmark (96), the Netherlands (95), France (9), the United Kingdom (95), Luxembourg (9) and Ireland (9). Conversely, respondents are least likely to be comfortable or indifferent with the possibility of working with a black person in Slovakia (8), the Czech Republic (5) and Bulgaria (58). Regarding having an Asian person as a colleague, respondents in Sweden (97), France (95), the Netherlands (95) and Denmark (9) are most likely to be 18 QC1: Regardless of whether you are actually working or not, please tell me, using a scale from 1 to 10, how comfortable you would feel if one of your colleagues at work belonged to each of the following groups? '1' means that you would feel, "not at all comfortable" and '10' that you would feel "totally comfortable". 1) A Roma person ) A black person ) an Asian person ) A white person. 1

24 comfortable or indifferent. On the other hand, respondents from Slovakia (9) and the Czech Republic (51) are least likely to be at ease with this situation. Overall, the attitudes toward colleagues that are Asian or black follow similar patterns and proportions across Member States. Respondents in Sweden are also most likely to say they would be at ease working with a Roma person (87 comfortable or indifferent), along with those in Spain (81), the United Kingdom (79), Luxembourg (78), the Netherlands (77) and Ireland (77). The lowest proportions can again be seen in the Czech Republic (9 comfortable or indifferent), Italy (7), Slovakia (1) and Bulgaria ().
25 Socio-demographic analysis shows that: Older people (aged 55 or over) are less likely to say they would be comfortable or indifferent about working with someone from an ethnic minority group (57 for a Roma person, 79 for a black person and 78 for an Asian person). Respondents with higher levels of education are more at ease with the possibility of working with someone from an ethnic minority group. For example, the proportion of respondents who say they would be comfortable or indifferent about working with a Roma person is 71 among those who left education at the age of 0 or older, falling to 5 among those who finished education by the age of 15. People with a diverse social circle are more at ease with the idea of working with different ethnic groups. This applies to people who have friends and acquaintances who are from different ethnic groups, as well as those whose social circle includes other groups at risk of discrimination (e.g. gay, lesbian or bisexual people).... Having sons or daughters in a love relationship with a Roma, black, Asian or white person All respondents were then asked, regardless of whether they had sons or daughters or not, how comfortable they would feel if one of their sons or daughters was in a love relationship with a person from a different ethnic group 19. Generally speaking, in comparison to the previous question about having a member or a group at risk of discrimination as a colleague, the levels of comfort and tolerance in this question are lower. Additionally, the differences between countries and socio-demographic categories become more pronounced. Almost all respondents say they would be very at ease if their son or daughter had a relationship with a white person (9 comfortable or indifferent). However, the proportions are lower in relation to an Asian person (69 comfortable or indifferent) and a black person (6), and lower still for a Roma person (5). In general, the comfort scores for this question are lower than seen above in relation to work colleagues, indicating that there can be a reasonable level of resistance to love relationships across ethnic groups. Country patterns mirror those seen above in relation to work colleagues. Respondents are most likely to be comfortable or indifferent about a son or daughter having a relationship with a black or Asian person in Sweden (89 and 9 respectively), Luxembourg (85 and 87), the Netherlands (8 and 8), Denmark (8 and 85), the United Kingdom (81 and 80) and France (79 and 85). The proportions 19 QC1: Regardless of whether you have children or not, please tell me, using a scale from 1 to 10, how comfortable you would feel if one of your children was in a love relationship with a person from each of the following groups. '1' means that you would feel, "not at all comfortable" and '10' that you would feel "totally comfortable". 1) A Roma person ) A black person ) an Asian person ) A white person.
, along with those in the United")
26 that are comfortable or indifferent are again lowest in Slovakia ( for a black person and 6 for an Asian person), the Czech Republic ( and 5 respectively) and Bulgaria (1 and ). Respondents in Sweden are most likely to say they would be comfortable or indifferent if one of their sons or daughters had a love relationship with a Roma person (76), along with those in the United Kingdom (65), Luxembourg (6) and Spain (60). The lowest proportions can be seen in the Czech Republic (11), Bulgaria (1) and Slovakia (17).
27 Socio-demographic patterns are the same as those seen in relation to work colleagues. Older people (aged 55 or over) are less likely to say they would be comfortable or indifferent if one of their sons or daughters had a relationship with someone from an ethnic minority group. Comfort levels are highest among respondents with higher levels of education, as well as those with a diverse social circle (friends or acquaintances in different ethnic groups, as well as those whose social circle includes other groups at risk of discrimination)... Age discrimination against older people Europeans are becoming more at ease with the idea of having someone aged over 75 in the highest political office..1. Having a person over 75 in the highest political office Many people across Europe would not be comfortable about having a person aged over 75 in the highest elected political position in their country. Less than half (6) say they would be comfortable (giving a score of 7-10 out of 10), with a further 7 spontaneously saying that they are indifferent, while 9 would be uncomfortable (score of less than 5) 0. EU citizens are more at ease than they were three years ago about having a person aged over 75 in the highest elected political position in their country. The proportion who are comfortable or indifferent has increased from 9 to 5 since the June 01 survey. Looking at variations by country, respondents are most at ease with having someone aged over 75 in the highest elected political position in Italy (75 comfortable or indifferent), Ireland (68), Spain (6), Portugal (6) and the United Kingdom (61). The lowest proportions can be seen in Cyprus (), Lithuania (), the Czech Republic (9) and Slovakia (). A comparison with the 01 results indicates that comfort levels are now higher in 5 countries. The largest increases are recorded in Italy (+6 percentage points) and Hungary (+1). The only countries showing a decrease are Lithuania (-) and Luxembourg (-1). 0 QC: And using a scale from 1 to 10, please tell me how you would feel about having a person from each of the following groups in the highest elected political position in (OUR COUNTRY). '1' means that you would feel "not at all comfortable" and '10' that you would feel "totally comfortable". 7) A person over 75 years old. 5
28 * NA= Not asked: this question was not asked in this country during the previous survey The socio-demographic analysis shows that, perhaps surprisingly, older respondents (aged 55 or over) are less at ease than younger people with the idea of having someone aged over 75 in the highest political office (8 are comfortable or indifferent, rising to 60 among 15- year olds). Otherwise, findings vary less across various other sociodemographic and cultural groups. 6
 give a score of 10 out of 10 for how comfortable they would be with this situation; overall, 80 would be comfortable (7-10 out of 10), with 11 indifferent (making a total of")
29 ... Working with a person aged over 60 A large majority of respondents say that they would be very comfortable working with someone aged over 60. More than six in ten (6) give a score of 10 out of 10 for how comfortable they would be with this situation; overall, 80 would be comfortable (7-10 out of 10), with 11 indifferent (making a total of 91 of respondents that would feel at ease working with someone aged over 60). Just would not be comfortable with it (score of less than 5) 1. In 15 countries, at least 90 of respondents are comfortable or indifferent about working with someone aged over 60. The largest proportions can be seen in Sweden (98 comfortable or indifferent), Denmark (96), France (96) and the Netherlands (96). Respondents in Slovakia (71), the Czech Republic (79) and Croatia (80) are least likely to be comfortable or indifferent on this issue. In all socio-demographic categories, large proportions of respondents would be at ease working with someone aged over QC1: Regardless of whether you are actually working or not, please tell me, using a scale from 1 to 10, how comfortable you would feel if one of your colleagues at work belonged to each of the following groups? '1' means that you would feel, "not at all comfortable" and '10' that you would feel "totally comfortable". 1) A person over 60 years. 7
30 .. Age discrimination against younger people Europeans are mostly comfortable about having someone aged under 0 in the highest elected political position..1. Having a person under 0 in the highest political office Respondents are generally more at ease about having a person aged under 0 in the highest elected political position in their country (61 comfortable or indifferent), than they are about having someone aged over 75 (5). Once again, there has been an increase in comfort levels since the June 01 survey, when 51 were comfortable or indifferent (+10 percentage points). In terms of country differences, respondents are most at ease with having someone aged under 0 in the highest elected political position in Croatia (80 comfortable or indifferent), Spain (77), Slovenia (76), Poland (7) and Portugal (7). The lowest comfort ratings can be seen in Germany (6 comfortable) and Finland (50). In 5 Member States, comfort levels are now higher than they were in 01. The largest increases can be seen in Slovakia (+ percentage points), Austria (+19), Slovenia (+18) and Germany (+18). The only country showing a decrease is Ireland (-6). Comfort level has remained unchanged in Luxembourg. QC: And using a scale from 1 to 10, please tell me how you would feel about having a person from each of the following groups in the highest elected political position in (OUR COUNTRY). '1' means that you would feel "not at all comfortable" and '10' that you would feel "totally comfortable". ) A person under 0 years old. 8
31 * NA= Not asked: this question was not asked in this country during the previous survey Older respondents (aged 55 or over) are less at ease than younger people with the idea of having someone aged under 0 in the highest political office (57 comfortable or indifferent, rising to 7 in the 15- age group). Otherwise, findings are very consistent across various socio-demographic and cultural groups. 9
32 ... Working with a person under 5 Most respondents say that they would be very comfortable working with someone aged under 5. Around two in three (65) give a score of 10 out of 10 for how comfortable they would be with this situation, and 81 would be comfortable (score of 7-10 out of 10), with a further 11 indifferent (making a total of 9 of respondents that would feel at ease working with someone under 5). Just would be uncomfortable with this scenario. Comfort scores are high in most countries. Respondents in Denmark, Sweden, Cyprus, France, Netherlands and Latvia (all 96 comfortable or indifferent) are most likely to be positive about working with someone aged under 5. Respondents in Slovakia (8) and Romania (85) are least likely to be comfortable or indifferent on this issue. The socio-demographic analysis shows that in all groups, a very large majority of the respondents would feel at ease about working with someone aged under 5. QC1: Regardless of whether you are actually working or not, please tell me, using a scale from 1 to 10, how comfortable you would feel if one of your colleagues at work belonged to each of the following groups? '1' means that you would feel, "not at all comfortable" and '10' that you would feel "totally comfortable". 1) A person under 5 years. 0
33 .5. Religion/belief Views are generally becoming more tolerant; however considerable variations remain between countries in attitudes to religious minorities.5.1. Having a person from a different religion than the majority of the population in the highest political office Respondents were asked how comfortable they would be if someone of a different religion from the majority of the population were appointed to the highest elected political position in their country. Across the EU as a whole, more than half of respondents (56) say they would be comfortable with this scenario, with a further 11 indifferent: overall, 67 of respondents would feel at ease if someone of a different religion from the majority of the population were appointed to the highest elected political position in their country. Meanwhile, 15 would be moderately comfortable and 16 would be uncomfortable. Europeans are now more at ease with the possibility of electing a head of state from a religious minority than they were three years ago (from 57 in 01 up to 67). There is considerable variation by country. The highest proportions that are comfortable or indifferent can be observed in Ireland (8), Portugal (80) and Spain (79). Conversely, respondents are least likely to be comfortable in Bulgaria (1), Cyprus (), the Czech Republic (5) and Malta (6). A comparison with the 01 results indicates that comfort levels are now higher in Member States. The largest increases are recorded in Italy (+18 percentage points) and Belgium (+17). The only countries where there has been a decrease are Bulgaria (-7), the Czech Republic (-) and Poland (-). QC: And using a scale from 1 to 10, please tell me how you would feel about having a person from each of the following groups in the highest elected political position in (OUR COUNTRY). '1' means that you would feel "not at all comfortable" and '10' that you would feel "totally comfortable". 5) A person from a different religion than the majority of the population. 1
34 * NA= Not asked: this question was not asked in this country during the previous survey Socio-demographic analysis shows that younger people are more at ease with having a person from a religious minority in the highest elected political office (7 of 15- year olds would be comfortable or indifferent, falling to 6 of those aged 55 or over). Comfort levels are also higher among those who left education at a later stage (7 of those who finished education at the age of 0 or older would be comfortable or indifferent, compared with 6 of those who ended education at the age of 15 or younger).
35 Respondents who are from a religious minority themselves are only slightly more likely to be at ease with the possibility of having a person from a religious minority in the highest elected political office (69 compared with 67 of respondents overall); the proportion that would be at ease is higher still among those from an ethnic minority (7). Comfort levels are also higher among those who have friends or acquaintances with different religions or beliefs (71 comfortable), as well as those who have friends or acquaintances from other groups at risk of discrimination (for example 7 among those with friends or acquaintances who are gay, lesbian or bisexual)..5.. Working with a Jewish, Muslim, Buddhist, Christian or atheist person All respondents were asked, regardless of whether they were actually working or not, how comfortable they would feel if one of their colleagues at work belonged to various religious groups 5. The findings show that most respondents say they would be at ease working with a Christian person: 67 give a score of 10 out of 10 and 9 would be comfortable or indifferent: 8 comfortable (score of 7-10 out of 10), with a further 1 indifferent (spontaneous answer). However, respondents would be slightly less at ease if a work colleague belonged to other groups: atheist (87 comfortable or indifferent), Jewish (8), Buddhist (81) and Muslim (71). Moreover, when it comes to working with a Muslim colleague, one in eight respondents (1) say they would be uncomfortable working with a Muslim person. This is higher than for any of the other religious groups (the next highest is 7 for working with a Buddhist person). Variations by country are very similar to those seen above in relation to ethnic minority group. Respondents in the following countries are most at ease with the possibility of working with people from different religious groups at risk of discrimination: Sweden (at least 89 comfortable or indifferent for each group), France (at least 88), the United Kingdom (at least 86), the Netherlands (at least 85), Ireland (at least 85), Denmark (at least 8) and Luxembourg (at least 8). In every single Member State, a majority of respondents would be at ease working with colleagues who were Christian, atheist, Jewish or Buddhist. However, the situation is different for Muslims, with which respondents in every Member State have the lowest levels of comfort and indifference. In two Member States, the Czech Republic (7) and Slovakia (7), less than half of respondents would feel at ease working with a Muslim person. 5 QC1: Regardless of whether you are actually working or not, please tell me, using a scale from 1 to 10, how comfortable you would feel if one of your colleagues at work belonged to each of the following groups? '1' means that you would feel, "not at all comfortable" and '10' that you would feel "totally comfortable". 5) A Jewish person 6) A Muslim person 7) A Buddhist person 8) A Christian person 9) An atheist person.

36 Socio-demographic analysis shows that: Older people (aged 55 or over) are less likely to say they would be at ease working with someone from a religious group at risk of discrimination (e.g. 66 comfortable or indifferent about working with a Muslim person (for 71 at EU level); 81 at ease about working with a Jewish person (for 8 at EU level), and 77 for a Buddhist person (81 at EU level)).
37 Respondents with higher levels of education are more at ease with the possibility of working with someone from an ethnic minority group. For example, 88 of those who left education at the age of 0 or older would be comfortable or indifferent about working with a Buddhist person, falling to 7 among those who finished education by the age of 15. People with a diverse social circle are more at ease with the idea of working with different ethnic groups. This applies to people who have friends and acquaintances who are from different religious groups, as well as to those whose social circle includes other groups at risk of discrimination (e.g. gay, lesbian or bisexual people)..5.. Having sons or daughters in a love relationship with a Jewish, Muslim, Buddhist, Christian or atheist person All respondents were then asked, regardless of whether they had sons or daughters or not, how comfortable they would feel if one of their sons or daughters was in a love relationship with a person from a different religious group 6. Close to nine in ten respondents say they would be at ease if their son or daughter had a relationship with a Christian person (89 comfortable or indifferent). However, the proportion that would be comfortable or indifferent is lower in relation to an atheist person (76) and then decreases further for Jewish and Buddhist people (69 and 65 respectively). The proportion is considerably lower for a relationship with a Muslim person (50). As many as 0 of respondents say they would be uncomfortable with regards to a son or daughter s relationship with a Muslim person. The next highest figure is 17 for a Buddhist person. Reflecting the country patterns seen in previous questions, respondents are most at ease with a son or daughter having a relationship with someone from a religious minority in Sweden (at least 69 comfortable or indifferent for every group), the United Kingdom (at least 69), France (at least 65) and Luxembourg (at least 6). Respondents are least at ease in the following countries, with figures shown for the proportion comfortable or indifferent in relation to a Muslim person: the Czech Republic (1), Slovakia (16), Cyprus (), Lithuania (5), Bulgaria (7) and Malta (1). Less than half of respondents would feel at ease in the following countries: Estonia (), Poland (), Greece (6), Latvia (7), Italy (1), Romania (), Germany (), Hungary (), Austria () and Belgium (7). 6 QC1: Regardless of whether you have children or not, please tell me, using a scale from 1 to 10, how comfortable you would feel if one of your children was in a love relationship with a person from each of the following groups. '1' means that you would feel, "not at all comfortable" and '10' that you would feel "totally comfortable". 5) A Jewish person 6) A Muslim person 7) A Buddhist person 8) A Christian person 9) An atheist person. 5

38 Socio-demographic patterns are the same as those seen in relation to work colleagues. Older people are less likely to say they would be at ease if one of their sons or daughters had a relationship with someone from a religious group at risk of discrimination (for example, of respondents aged 55+ would feel comfortable or indifferent having a son or daughter in a relationship with a Muslim person, compared to 60 of respondents aged 15-). Comfort levels are highest among respondents with higher levels of education (7 of those who left education aged 0 or older would feel 6
.")
39 comfortable or indifferent with a son or daughter in a relationship with a Buddhist, compared to 56 of those who left education aged 15 or less), as well as those with a diverse social circle (friends or acquaintances in different religious groups, as well as those whose social circle includes other groups at risk of discrimination). 7
40 .6. Disability Eight respondents in ten would be comfortable if a person with a disability held the highest elected position in their country.6.1. Having a person with a disability in the highest political office The majority of respondents (69) say that they would be comfortable (score of 7-10 out of 10) if a person with a disability held the highest elected position in their country, with a further 11 indifferent. Eight percent say they would be uncomfortable with this scenario 7. The proportion of respondents at ease if a person with a disability held the highest elected position in their country (80) is higher than was recorded in the previous survey in June 01 (70). There are large variations between Member States. Respondents in Ireland (9 comfortable or indifferent), Sweden (9) and the United Kingdom (90) are most positive about having a person with disabilities in the highest elected position in their country. The lowest proportions can be found in the Czech Republic (5), Slovakia (5), Romania (55), Lithuania (57) and Hungary (58). In nearly all countries, respondents are now more at ease with having a person with disabilities in the highest elected position than was the case in 01. The only exceptions are Luxembourg (- percentage points), Denmark (-), Poland and Lithuania (no change). The largest increases can be seen in Italy (+0), Estonia (+17) and Cyprus (+15). 7 QC: And using a scale from 1 to 10, please tell me how you would feel about having a person from each of the following groups in the highest elected political position in (OUR COUNTRY). '1' means that you would feel "not at all comfortable" and '10' that you would feel "totally comfortable". 6) A person with a disability. 8

41 * NA= Not asked: this question was not asked in this country during the previous survey Findings are generally stable across socio-demographic groups, with large majority of respondents in each category saying that they would feel at ease with having a person with disabilities in the highest elected position in their country. 9
42 .6.. Working with a person with a disability Respondents generally say they would be very comfortable working with someone with a disability. More than three-quarters (77) say they would be comfortable (score of 7-10 out of 10), including 57 who give a score of 10 out of 10, while a further 10 spontaneously say that they are indifferent, reflecting a relaxed or tolerant position. Overall, 87 of respondents would feel at ease working with someone with a disability. Just say they would be uncomfortable 8. Analysing the findings by country, the highest ratings can be seen among respondents in Ireland (96 comfortable or indifferent), France (96) and Sweden (95). Respondents in Slovakia (66 comfortable or indifferent), the Czech Republic (71), Hungary (7) and Romania (7) are least positive about working with a person with disabilities. There are only minor variations between socio-demographic categories: in all of them, large majorities of respondents would feel at ease working with a person with disabilities. 8 QC1: Regardless of whether you are actually working or not, please tell me, using a scale from 1 to 10, how comfortable you would feel if one of your colleagues at work belonged to each of the following groups? '1' means that you would feel, "not at all comfortable" and '10' that you would feel "totally comfortable". 1) A person with a disability. 0
.")
43 .6.. Having sons or daughters in a relationship with a person with a disability Respondents were asked how comfortable they would be if one of their sons or daughters had a love relationship with a person with disabilities (regardless of whether they actually have sons or daughters or not). Across the EU as a whole, more than half of respondents (59) say they would be comfortable with this scenario, with a further 8 indifferent 9, making a total of 67 of respondents at ease with their sons or daughters having a love relationship with a person with disabilities. There is considerable variation by country. A large proportion of respondents say they would be comfortable or indifferent in Sweden (9), Ireland (87), the United Kingdom (85), Spain (8) and the Netherlands (80). However, the proportion is much lower in Bulgaria (1), the Czech Republic (6), Slovakia (6) and Romania (). The proportion of respondents who would feel at ease is also less below 50 in Greece (6) and Lithuania (8). Looking at socio-demographic variations, respondents with higher levels of education are more at ease with the possibility of one of their sons or daughters having a relationship with a person with disabilities (7 of those who left education at the age of 0 or older are comfortable or indifferent, compared with 6 of those who finished education before the age of 0). 9 QC1: Regardless of whether you have children or not, please tell me, using a scale from 1 to 10, how comfortable you would feel if one of your children was in a love relationship with a person from each of the following groups. '1' means that you would feel, "not at all comfortable" and '10' that you would feel "totally comfortable". 1) A person with a disability. 1
44 .7. Gender.7.1. Having a woman in the highest political office Europeans are generally very comfortable with having a woman in the highest elected position in their country The vast majority of respondents (9) say that they would be at ease about having a woman in the highest elected position in their country: 8 would be comfortable (score of 7-10 out of 10), with a further 10 indifferent. Just say they would be uncomfortable with this scenario 0. The proportion that is comfortable or indifferent is higher than was recorded in the previous survey in June 01 (increase from 85 to 9). There are only few variations between countries: in all of them, a large majority of respondents would feel comfortable or indifferent with having a woman in the highest elected position in their country. Highest proportions are seen in Sweden (98 comfortable or indifferent), Denmark (97), Ireland (97), Spain (96), the Netherlands (96) and Malta (96), while lowest ratings can be found in Romania (78), Slovakia (81) and Austria (85). In countries, respondents are now more at ease with having a woman in the highest elected position than was the case in 01. The only exceptions are Slovenia (- percentage points), Luxembourg and Sweden (no change). The largest increases can be seen in Italy (+19) and Portugal (+1). 0 QC: And using a scale from 1 to 10, please tell me how you would feel about having a person from each of the following groups in the highest elected political position in (OUR COUNTRY). '1' means that you would feel "not at all comfortable" and '10' that you would feel "totally comfortable". 1) A woman.

45 * NA= Not asked: this question was not asked in this country during the previous survey Once again, variations between socio-demographic groups are very limited, with very large majorities in all being at ease about having a woman in the highest elected position in their country.

46 .8. Diversity in the media The media is seen as improving in its reflection of diversity, although some groups are less well represented than others Respondents were asked whether the media sufficiently reflects diversity with regards to various groups 1. Overall, the perceived diversity in the media varies depending on the group in question. Most respondents think that diversity is sufficiently reflected in the media (either definitely or to some extent ) in terms of gender (7) and young people aged under 5 (66). Slightly lower proportions although still a clear majority feel that diversity is sufficiently reflected in the media in terms of ethnic origin (60), religion or beliefs (59) and sexual orientation (58). In each case, around a third of respondents do not think that diversity is sufficiently reflected in relation to these characteristics. Respondents are less likely to think that diversity is sufficiently reflected in the media in terms of disability (5), people aged over 75 (50) and gender identity (1). In each case, a little over two in five respondents think that the media does not sufficiently reflect diversity in relation to these characteristics. There has been an increase in the proportion who thinks diversity is sufficiently reflected in the media since 009 when the same question was made. The largest increases can be observed in relation to gender and religion or beliefs (+7 percentage points in both cases). 1 Do you think that diversity is sufficiently reflected in the media, in terms of? 1) Disability ) Ethnic origin ) Religion or beliefs ) Age (people over 75) 5) Age (people under 5) 6) Sexual orientation (being gay, lesbian or bisexual) 7) Gender (male or female) 8) Gender identity (being transgender or transsexual).
47 Analysis at national level reveals that perception of diversity in the media varies importantly between countries. Overall, the media is perceived to reflect diversity most in Finland, the United Kingdom, Malta, Germany, the Netherlands and Austria. The media in Spain, Portugal, Croatia and France is considered least diverse by respondents in those countries. Respondents in Germany are the most likely to think that diversity is sufficiently reflected in the media in terms of gender (81), while respondents in Bulgaria (51) and Croatia (5) are least likely to say that this is the case. Germany is also one of the countries where respondents are most likely to think the media reflects diversity in terms of people aged under 5 (7), along with Italy (7), the Netherlands (7), Sweden (7) and the United Kingdom (71). The lowest proportions can be observed in Greece (6), Estonia (50), Bulgaria (51), Croatia (51) and Slovenia (5). In relation to people aged 75 or over, respondents in Finland (6) and Italy (59) are most likely to think that diversity is sufficiently reflected in the media, while respondents in Spain () and Luxembourg (5) are least likely to say this. The proportion of respondents that think the media sufficiently reflects diversity in terms of ethnic origin is highest in Finland (7) and the United Kingdom (7), while this is lowest among respondents in Spain (7) and Portugal (6). Respondents in Spain (9) and Portugal (5) are also the least likely to think that diversity is sufficiently reflected in the media in terms of religion or beliefs. The highest proportion can again be seen in Finland (7), followed by the Netherlands (69), Austria (68), Germany (68) and Italy (68). Respondents in Finland (79), the Netherlands (75) and Malta (7) are most likely to think that diversity is sufficiently reflected in the media in terms of sexual orientation, with the lowest proportions seen in Bulgaria () and Romania (). The proportion that say the media sufficiently reflects diversity in terms of disability is again highest in Finland (7), followed by Malta (71), Estonia (66), Italy (65) and Poland (65), while respondents in France (8), Sweden () and Spain (6) are least likely to say this. Finally, respondents in Malta (6) are most likely to say that diversity is sufficiently reflected in terms of gender identity, followed by those in Austria (60), Slovenia (58), Finland (57), the United Kingdom (56), Poland (55) and Ireland (5). The lowest proportions can be observed in France (), Spain (7) and Luxembourg (8). 5
 as well as other characteristics.")
48 * NA= Not asked: this question was not asked in this country during the previous survey Findings are generally consistent across different socio-demographic groups. Men are slightly more likely than women to say that diversity is sufficiently reflected in the media, both in relation to gender (7 of men compared with 70 of women) as well as other characteristics. Attitudes are similar across age groups, with only minor variations in relation to diversity on age grounds. Older respondents (aged 55 or over) are slightly less likely to think 6
49 diversity is sufficiently reflected in terms of people aged over 75 (7), compared with those aged 5-9 (51) and 0-5 (5), although the figure is lower among those aged 15- (6). Similarly, those in the 15- age group are slightly less likely to say that diversity is sufficiently reflected in terms of people aged under 5 (65), compared with those aged 5-9 (69) and 0-5 (68), although the lowest proportion is among those aged 55 or over (6). In general, respondents from various groups at risk of discrimination are neither more nor less likely to think that diversity is sufficiently reflected in terms of their own characteristic. For example, 60 of ethnic minority respondents think that diversity is sufficiently reflected in terms of ethnic origin, the same proportion as for the sample as a whole (60). The one exception is that people with disabilities are less likely than other respondents to say that diversity is sufficiently reflected in the media in terms of disability ( compared with 5 overall). People who think that discrimination is widespread in their country are generally less likely to say that diversity is sufficiently reflected in the media. For example, 1 of respondents who think there is widespread discrimination in relation to gender identity think that diversity is sufficiently reflected in this respect, compared with 7 of those who think this type of discrimination is rare. In other words, those who see evidence of discrimination in their country tend to be more critical of the way in which the media reflects diversity. 7
50 . SPOTLIGHT ON ATTITUDES TOWARDS LGBT PEOPLE This section focuses on public perceptions of lesbian, gay, bisexual and transgender (LGBT) people. Firstly, the analysis examines attitudes to sexual orientation by considering how comfortable respondents would feel with different scenarios relating to gay, lesbian or bisexual people. The section also examines general attitudes to gay, lesbian or bisexual people, for example in relation to rights and same sex marriage. The second part of this section looks at perceptions of gender identity. Firstly, this is examined in terms of how comfortable people would feel with different scenarios relating to a transgender or transsexual person, before looking at attitudes to changing civil documents..1. Sexual orientation Attitudes to gay, lesbian and bisexual people vary by country, as well as by age, level of education and religious identity.1.1. General attitudes towards gay, lesbian or bisexual persons Respondents were asked whether they agree or disagree with three statements about gay, lesbian or bisexual people. In each case, the majority of respondents express tolerant or supportive views: 71 agree that gay, lesbian and bisexual people should have the same rights as heterosexual people; 67 agree that there is nothing wrong in a sexual relationship between two persons of the same sex; and 61 agree that same sex marriages should be allowed throughout Europe. The proportions that disagree with the statements are, 7 and respectively. QC16: To what extent do you agree or disagree with each of the following statements? 1) Gay, lesbian and bisexual people should have the same rights as heterosexual people. ) There is nothing wrong in a sexual relationship between two persons of the same sex. ) Same sex marriages should be allowed throughout Europe. 8
51 Although no direct trend data are available, a related question on same sex marriage was asked in a Eurobarometer survey in September 006 (66). In that survey, of respondents agreed that homosexual marriages should be allowed throughout Europe, while 9 disagreed. Although the question wording is slightly different, results are comparable: it is clear that attitudes have become more tolerant over time, to the point where 61 now agree that same sex marriages should be allowed throughout Europe. There are large variations between Member States, and these are consistent across the three statements. Respondents in Sweden and the Netherlands are most likely to agree with each of the three statements. For example, 96 of respondents in the Netherlands and 95 in Sweden agree that gay, lesbian and bisexual people should have the same rights as heterosexual people. There then follows a group of countries where at least three-quarters of respondents agree with each of the three statements: Denmark (at least 87), Spain (at least 8), Ireland (at least 80), Belgium (at least 77) and Luxembourg (at least 75). Looking at the question of same sex marriages being allowed throughout Europe, and comparing the national results to the result from the similar question in September 006 (66), the two largest and most striking increases in the level of agreement occur in Malta (+7) and Ireland (+9). In terms of policies, Malta has made a remarkable progress in improving the rights of LGBTI people in past few years in protecting LGBT minorities: in 01 the advocacy group ILGA-Europe ranked Malta at the bottom of all EU Member States with regards protections for LGBT members, and in 015 they ranked Malta as third in the EU 5. Ireland, meanwhile, became the first country in the world to legalise gay marriage by referendum, only a few weeks before fieldwork for this survey began 6. By contrast, a minority of respondents agree with the statements in Latvia (between 19 and agree with the three statements), Romania (1-6), Slovakia (- 6), Lithuania (-), Poland (8-7), Hungary (9-9), Croatia (7-8) and Estonia (1-). Standard Eurobarometer autumn 006: I stands for Intersex The referendum was held Friday May 015: the Yes won with 6.1 of votes. 9

52 There are clear variations among socio-demographic groups, which can be seen across the three statements. Women are more likely than men to agree with the statements; for example, 7 of women agree that gay, lesbian and bisexual people should have the same rights as heterosexual people, compared with 68 of men. Younger people are more likely than older people to agree with the three statements; for example, 77 of 15- year olds agree that there is nothing wrong in a sexual relationship between two persons of the same sex, falling to 57 of those aged 55 or over. 50
, compared with those who finished")
53 There is also a large difference by level of education. Those who left education at the age of 0 or older are more likely to agree (for example 67 agree that same sex marriages should be allowed throughout Europe), compared with those who finished education earlier (9 of those who ended education by the age of 15 agree with the same statement). Respondents who classify themselves as belonging to a minority with regards to sexual orientation are much more likely to agree with all of the statements (8-89 agree), as are those who have friends or acquaintances who are gay, lesbian or bisexual (8-89 agree). 51
54 .1.. Having a gay, lesbian or bisexual person in the highest political office Respondents were asked how comfortable they would be if a gay, lesbian or bisexual person were appointed to the highest elected political position in their country. Across the EU as a whole, just over half of respondents (5) say they would be comfortable with this scenario, with a further 11 indifferent (making a total of 65 of respondents at ease if a gay, lesbian or bisexual person were appointed to the highest elected political position in their country). Meanwhile, 1 would be moderately comfortable and 1 would be uncomfortable 7. There has been an increase since 01 in the proportion that are comfortable or indifferent (from 57 to 65). There is considerable variation by country. The highest proportions that are comfortable or indifferent can be observed in Sweden (91), the Netherlands (90), Denmark (89), Luxembourg (86) and Ireland (85). Conversely, respondents are least likely to be at ease in Romania (), Bulgaria (5), Lithuania (8), Slovakia (1) and Cyprus (). Overall, less than half of respondents would feel comfortable or indifferent in 10 Member States. A comparison with the 01 results indicates that in countries comfort levels are now higher. The largest increases are recorded in Portugal (+1 percentage points), Hungary (+18) and Italy (+16). The only countries where there has been a decrease are Romania (-7) and Bulgaria (-). 7 QC: And using a scale from 1 to 10, please tell me how you would feel about having a person from each of the following groups in the highest elected political position in (OUR COUNTRY). '1' means that you would feel "not at all comfortable" and '10' that you would feel "totally comfortable". ) A gay, lesbian or bisexual person. 5
55 * NA= Not asked: this question was not asked in this country during the previous survey Socio-demographic analysis shows that women are more likely than men to be comfortable or indifferent with having a gay, lesbian or bisexual person in the highest elected political office (68 compared with 6). Younger people are more at ease (7 of 15- year olds would be comfortable or indifferent, falling to 57 of those aged 55 or over). Comfort levels are also higher among those who left education at a later stage (75 of those who finished education at the age of 0 or older would be comfortable or indifferent, compared with 55 of those who ended education at the age 5
, as well as those who have friends or acquaintances from other groups at risk of")
56 of 15 or younger). Respondents who describe themselves as being part of a minority with regards to sexual orientation are more likely to be comfortable or indifferent (76). Comfort levels are also higher among those who have friends or acquaintances who are gay, lesbian or bisexual (8), as well as those who have friends or acquaintances from other groups at risk of discrimination (for example 70 among those with friends or acquaintances who are from a different religion)..1.. Working with a gay, lesbian or bisexual person All respondents were asked, regardless of whether they were actually working or not, how comfortable they would feel if one of their colleagues at work were gay, lesbian or bisexual 8. Three-quarters of respondents answer that they would be at ease working with a gay, lesbian or bisexual person: 6 say they would be comfortable (giving a score of 7-10 out of 10), with a further 1 spontaneously saying they are indifferent. One in eight respondents (1) say they would be uncomfortable. Variations by country are very similar to those seen in the previous question. Respondents in the following countries are most at ease with the possibility of working with a gay, lesbian or bisexual person: Sweden (96 comfortable or indifferent), the Netherlands (95), Denmark (9) and Luxembourg (90). Less than half of respondents say they would be comfortable or indifferent in the following countries: Romania (1), Bulgaria (1), Slovakia () and Lithuania (). 8 QC1: Regardless of whether you are actually working or not, please tell me, using a scale from 1 to 10, how comfortable you would feel if one of your colleagues at work belonged to each of the following groups? '1' means that you would feel, "not at all comfortable" and '10' that you would feel "totally comfortable". 10) A gay, lesbian or bisexual person. 5
57 Socio-demographic analysis shows that: Women are slightly more likely than men to say they would be comfortable or indifferent working with a gay, lesbian or bisexual person (77 compared with 7). Older people (aged 55 or over) are less likely to say they would be at ease (67 comfortable or indifferent, compared with 79-8 in younger age groups). Respondents with higher levels of education are more at ease with the possibility of working with a gay, lesbian or bisexual person: 8 of those who left education at the age of 0 or older would be comfortable or indifferent about this, falling to 6 among those who finished education by the age of 15. People with a diverse social circle are more at ease with the idea of working with gay, lesbian or bisexual people. This applies to people who have friends and acquaintances who are gay, lesbian or bisexual (9) and also to a slightly lesser extent - those whose social circle includes other groups at risk of discrimination..1.. Having sons or daughters in a relationship with a person of the same sex All respondents were then asked, regardless of whether they had sons or daughters or not, how comfortable they would feel if one of their sons or daughters was in a love relationship with a person of the same sex 9. Less than half of respondents () say they would be comfortable if their son or daughter had a relationship with a person of the same sex, with a further 7 indifferent (spontaneous answer). Overall, 51 of respondents would feel at ease if one of their sons or daughters was in a love relationship with a person of the same sex. Around a third () say they would be uncomfortable. Reflecting the country patterns seen in previous questions, respondents are most at ease with a son or daughter having a relationship with someone of the same sex in Sweden (8 comfortable or indifferent), the Netherlands (79), Ireland (7) and Denmark (7). However, the proportions are very low in Bulgaria (9 comfortable or indifferent), Cyprus (1), Lithuania (1), Slovakia (1), Greece (16) and Latvia (18). Overall, less than 50 of respondents say that they would be comfortable or indifferent in a majority of countries (16 Member States). The difference between Member States with regards to respondents levels of comfort is one of the largest in the entire survey (8 in Sweden to 9 in Bulgaria), highlighting the polarisation of tolerance of LGBT minorities on a personal level (one s children). 9 QC1: Regardless of whether you have children or not, please tell me, using a scale from 1 to 10, how comfortable you would feel if one of your children was in a love relationship with a person from each of the following groups. '1' means that you would feel, "not at all comfortable" and '10' that you would feel "totally comfortable". 10 A person of the same sex. 55
, while women are slightly")
58 Socio-demographic patterns are similar to those seen in relation to work colleagues. Older people are less likely to say they would be at ease if one of their sons or daughters had a relationship with someone of the same sex (5 comfortable or indifferent), while women are slightly more likely than men to be comfortable or indifferent (5 compared with 9). Comfort levels are higher among respondents with higher levels of education (60 of those who ended education at the age of 0 or older), those who classify themselves as being part of a minority with regards to sexual orientation (77), and those with a diverse social circle - friends or acquaintances who are gay, lesbian or bisexual (71), as well as those whose social circle includes other groups at risk of discrimination. 56
 to 10 (totally comfortable) 0. Most respondents say they would be at ease with heterosexual couples showing affection in public (7 comfortable or indifferent).")
59 .1.5. Seeing gays or lesbians showing affection in public Respondents were asked how comfortable they would feel with people in various groups showing affection in public, again using a scale of 1 (not at all comfortable) to 10 (totally comfortable) 0. Most respondents say they would be at ease with heterosexual couples showing affection in public (7 comfortable or indifferent). However, the proportion is lower with regards to gay couples (9) and lesbian couples (51). Around a third of respondents say they would be uncomfortable with gay couples (8) or lesbian couples () showing affection in public, higher than for heterosexual couples (16). 0 QC18: Using a scale from 1 to 10, please tell me how comfortable you would feel with people in each of the following groups showing affection in public (e.g. kissing or holding hands). '1' means that you would feel, "not at all comfortable" and '10' that you would feel "totally comfortable". 1) Heterosexual couples ) Gay couples (two men) ) Lesbian couples (two women). 57
60 There are considerable variations between countries. Respondents are most likely to be at ease about gay or lesbian couples showing affection in public in Sweden (78 and 8 respectively would be comfortable or are indifferent), Spain (69 and 71), Denmark (68 and 7) and Luxembourg (66 and 70). The lowest proportions can be seen in Lithuania (1 and 16 respectively), Latvia (16 and ), Romania (17 and 19), Slovakia (18 and 1) and Bulgaria (19 and ). While the differences are limited, in every Member State the level of comfort is higher for lesbian couples than for gay couples. To some extent, these variations reflect attitudes to showing affection in public (at all) as much as attitudes towards gay or lesbian couples. The same country patterns are evident in relation to heterosexual couples showing affection in public, although the differences are not as great; the highest proportion is in Sweden (88 comfortable or indifferent), with the lowest in Romania (0). In the table below, the difference in the proportion of respondents at ease with public displays of affection for heterosexual and gay couples is shown. Since the levels of comfort for lesbian couples are all higher than for gay couples, this category is not included. The smallest difference in levels of being at ease is from respondents in Sweden (+10 percentage point difference between heterosexual couples and gay couples), Ireland (+1) and Spain (+15). The largest difference is from respondents in Greece (+9), followed by the Czech Republic (+6), Slovakia and Estonia (both +). 58

61 59
, while")
62 Socio-demographic variations are similar to those seen on other questions in relation to gay, lesbian or bisexual people. Older people are less likely to feel at ease with gay or lesbian couples showing affection in public (6 and 8 of respondents aged 55 or over respectively are comfortable or indifferent), while comfort levels are higher among those who stayed in full-time education longer (58 and 61 respectively among those who ended education at the age of 0 or older), those who classify themselves as part of a minority with regards to sexual orientation (77 and 78) and those who have friends or acquaintances who are gay, lesbian or bisexual (69 and 7). As noted above in relation to country differences, these variations partly reflect attitudes to showing affection in public (at all) as much as attitudes towards gay or lesbian couples. 60
63 .. Gender identity Improvement in the levels of comfort of citizens with having a transgender or transsexual person in the highest political office..1. Having a transgender or transsexual person in the highest political office 1 Across the EU as a whole, more than half of respondents (5) say they would be comfortable () or indifferent (10) (spontaneous answer) with having a transgender or transsexual person in the highest political office, while 9 would be uncomfortable. Compared with 01, the proportion that are comfortable or indifferent has increased (from up to 5), and now forms a majority. There are wide variations between countries: the highest proportions that are comfortable or indifferent can be observed in Sweden (81), Denmark (7), Spain (7), the Netherlands (71) and Ireland (71). Conversely, respondents are least likely to be comfortable in Bulgaria (0), Lithuania (), Slovakia (), Romania (5), Latvia (5) and Cyprus (5). In Member States, comfort levels are now higher than they were in 01. The largest increases are recorded in Malta (+ percentage points), Finland (+) and Portugal (+0). The only country where there has been a decrease is Romania (-), while there has been no change in Bulgaria and Poland. 1 Respondents were read a definition and description for transgender and transsexual persons before the questions QC: And using a scale from 1 to 10, please tell me how you would feel about having a person from each of the following groups in the highest elected political position in (OUR COUNTRY). '1' means that you would feel "not at all comfortable" and '10' that you would feel "totally comfortable". 8) A transgender or transsexual person. 61
.")
64 * NA= Not asked: this question was not asked in this country during the previous survey Socio-demographic analysis shows that women are more likely than men to be comfortable or indifferent with having a transgender or transsexual person in the highest elected political office (56 compared with 8). Younger people are more at ease (6 of 15- year olds would be comfortable or indifferent, falling to 5 of those aged 55 or over). Comfort levels are also higher among those who left education at a later stage (59 of those who finished education at the age of 0 or older would be 6
.")
65 comfortable or indifferent, compared with of those who ended education at the age of 15 or younger). Respondents who describe themselves as being part of a minority with regards to sexual orientation are more likely to be comfortable or indifferent (7). Comfort levels are also higher among those who have friends or acquaintances who are transgender or transsexual (75), as well as those who have friends or acquaintances from other groups at risk of discrimination.... Working with a transgender or transsexual person All respondents were asked, regardless of whether they were actually working or not, how comfortable they would feel if one of their colleagues at work was a transgender or transsexual person. More than two-thirds of respondents (67) say they would be comfortable (56) or indifferent (11) (spontaneous answer) if one of their colleagues at work was a transgender or transsexual person. Around one in six (17) say that they would be uncomfortable with this scenario. Variations by country are similar to those seen in the previous question. Respondents in the following countries are most at ease with the possibility of working with a transgender or transsexual person: Sweden (90 comfortable or indifferent), Ireland (85), the Netherlands (85), Denmark (8), the United Kingdom (8), Spain (8) and Luxembourg (81). Respondents are least likely to say they would be comfortable or are indifferent in the following countries: Slovakia (), Bulgaria (9), Lithuania (9) and Romania (0). QC1: Regardless of whether you are actually working or not, please tell me, using a scale from 1 to 10, how comfortable you would feel if one of your colleagues at work belonged to each of the following groups? '1' means that you would feel, "not at all comfortable" and '10' that you would feel "totally comfortable". 11) A transgender or transsexual person. 6
66 Socio-demographic analysis shows that: Women are more likely than men to say they would be comfortable or are indifferent (70 compared with 6). Older people (aged 55 or over) are less likely to say they would be at ease with working with a transgender or transsexual person (60 comfortable or indifferent, compared with 70-7 in younger age groups). Respondents with higher levels of education are more at ease with the possibility of working with a transgender or transsexual person: 75 of those who left education at the age of 0 or older would be comfortable or indifferent about this, falling to 56 among those who finished education by the age of 15. People are more at ease with the scenario if they have friends and acquaintances who are transgender or transsexual (88) and if they have a diverse social circle generally. 6
67 ... Having sons or daughters in a relationship with a transgender or transsexual person Almost four in ten respondents (8) say they would be comfortable or indifferent if their son or daughter had a relationship with a transgender or transsexual person, while say they would be uncomfortable. These are the most negative findings for any of the various questions examining tolerance towards groups at risk of discrimination. Reflecting the country patterns seen in previous questions, respondents are most at ease with a son or daughter having a relationship with a transgender or transsexual person in Sweden (68 comfortable or indifferent), which is the only country where more than two-thirds of respondents would feel at ease. More than half of respondents would also feel at ease in Ireland (58), the United Kingdom (56), the Netherlands (55) and Spain (5). However, the proportions are very low in Bulgaria (7 comfortable or indifferent), Lithuania (10), Slovakia (10), Cyprus (11), Greece (1) and Latvia (1). Socio-demographic patterns are similar to those seen in relation to work colleagues. Older people are less likely to say they would be at ease if one of their sons or daughters had a relationship with a transgender or transsexual person ( comfortable or indifferent). Comfort levels are higher among respondents with higher levels of education ( of those who ended education at the age of 0 or older), those who classify themselves as being part of a minority with regards to sexual orientation (66), and those with a diverse social circle friends or acquaintances who are transgender or transsexual (66), as well as those whose social circle includes other groups at risk of discrimination. QC1: Regardless of whether you have children or not, please tell me, using a scale from 1 to 10, how comfortable you would feel if one of your children was in a love relationship with a person from each of the following groups. '1' means that you would feel, "not at all comfortable" and '10' that you would feel "totally comfortable". 11 A transgender or transsexual person. 65
 believe that transgender or transsexual persons should be able to change their civil documents to match their inner gender identity.")
68 ... Should transgender and transsexual persons be able to change their ID A large majority of respondents think that transgender and transsexual persons should be able to change their civil documents Over six in ten respondents (6) believe that transgender or transsexual persons should be able to change their civil documents to match their inner gender identity. The support is quite strong with more than one-third of respondents saying yes, definitely (6). A quarter of respondents (5) disagree, saying either that this should definitely not happen (1) or not really (1) 5. A further 1 of respondents answer that they don t know. Findings vary considerably between different Member States. In 18 countries, the majority of respondents think that transgender or transsexual persons should be able to change their civil documents to match their inner gender identity, with the highest proportion seen in the Netherlands (89), followed by Malta (81), Sweden (80), Spain (80), Denmark (79) and Luxembourg (78). 5 QC19: Do you think that transgender or transsexual persons should be able to change their civil documents to match their inner gender identity? 66

69 However, the proportion is much lower in Bulgaria (9), Romania (9), Hungary () and Slovakia (8), which are the only four Member States where the total no outnumber the yes. Analysis of socio-demographic groups again shows a difference by level of education. Respondents who ended full-time education at the age of 0 or older are more likely to think that transgender or transsexual persons should be able to change their civil documents to match their inner gender identity (7), compared with those who ended their education at the age of (60) or at the age of 15 or younger (5). There is also a difference by age, with older people less likely to agree that transgender or transsexual persons should be able to change their civil documents to match their inner gender identity (57 compared with in younger age groups). Women are more likely than men to say this (66 compared with 60). The proportion that agree is also higher among those who classify themselves as being part of a minority with regards to sexual orientation (79), and those with a diverse social circle those who have friends or acquaintances who are transgender or transsexual (8), as well as those whose social circle includes other groups at risk of discrimination. Despite these variations, in all socio-demographic categories, majorities of respondents consider that transgender or transsexual persons should be able to change their civil documents to match their inner gender identity. 67
70 . EXPERIENCE OF DISCRIMINATION AND KNOWLEDGE OF THE LAW In this section we look at the extent to which Europeans have personally experienced discrimination. The section also examines the extent to which Europeans are aware of their rights in the event of discrimination and harassment, as well as the organisations that they would prefer to contact if they were a victim of discrimination..1. Personal experience of discrimination One in five respondents say they have felt discriminated against or harassed on one or more grounds in the previous 1 months Around one in five respondents (1) say that, in the 1 months preceding the survey, they personally felt discriminated against or harassed on the basis of one or more of the following grounds: being over 55 years old (5), their gender (), ethnic origin (), religion or beliefs (), disability (), being under 0 years old (), sexual orientation (), gender identity (1) or for another reason (6) 6. In total, 5 of respondents say that they felt discriminated against on multiple grounds. Compared with 01, there has been an increase in the overall proportion who say they have experienced some form of discrimination or harassment (from 16 to 1), along with increases (of no more than one percentage point) for discrimination or harassment on individual grounds. 6 QC: In the past 1 months have you personally felt discriminated against or harassed on one or more of the following grounds? Please tell me all that apply. Respondents had the possibility to give several answers, as they could have felt discriminated against or harassed on the basis of several grounds. 68
71 For the most part, there are only minor variations between countries in the proportions that say they have experienced discrimination or harassment on various grounds over the previous 1 months. The notable findings are as follows: Respondents in Sweden are more likely than those in other countries to say they have experienced discrimination or harassment on the grounds of gender (11). The proportion that say they have experienced discrimination or harassment on the grounds of ethnic origin is highest among respondents in Luxembourg (8). A relatively high proportion of respondents in Italy say they have experienced discrimination or harassment on the grounds of religion or beliefs (5), disability (), sexual orientation () and gender identity (). Respondents in the Czech Republic (8) and Slovakia (7) are more likely than those in other countries to say they have been discriminated against or harassed on the grounds of being over 55 years old. The figures in Slovakia are also high for a number of other grounds: being under 0 years olds (), ethnic origin (5), sexual orientation () and gender identity (). Overall, a quarter or more of respondents have felt discriminated against or harassed in Croatia (), Austria (9), Luxembourg (8), Slovakia (7), Italy (6), Romania (6), the Czech Republic (5) and Sweden (5). At the other end of the scale, this proportion is lowest in Greece (11), Slovenia (1) and Malta (1). This proportion has increased in a countries, most strikingly in Ireland (, +16 percentage points) and Luxembourg (8, +10). Conversely, it has lost ground in Latvia (16, -), Belgium (19, -1) and Bulgaria (16, -1). 69

72 70
73 As well as considering the proportion of all EU citizens who say they have been discriminated against, it is important to examine experience of discrimination and harassment among groups at risk of discrimination. This shows that: 0 of respondents who belong to an ethnic minority group say they have experienced discrimination or harassment on the grounds of ethnic origin. of those from a religious minority say they have experienced discrimination or harassment on the grounds of religion or beliefs. 7 of those who describe themselves as being part of a minority in terms of disability report discrimination or harassment on the grounds of disability. of those who say they are part of a minority with regards to sexual orientation (like being gay, lesbian, bisexual, transgender or transsexual) have experienced discrimination or harassment on the ground of sexual orientation (being gay, lesbian or bisexual). Four percent of them have experienced discrimination or harassment on the ground of gender identity (being transgender or transsexual). Discrimination on the grounds of gender has been experienced by 6 of women and of men in the previous 1 months. 10 of respondents aged 55 or over say they have felt discriminated against or harassed on the grounds of being over 55 years old, while this applies to 6 of 15- year olds on the grounds of being under 0. Respondents who report being discriminated against on the basis of gender identity are most likely to report being discriminated on at least one other ground (8). Furthermore, a majority of respondents who report discrimination on the basis of sexual orientation (7), religion (6), disability (55) and ethnic origin (5) also report discrimination on at least one other ground. This is in stark contrast to the overall population in which only 1 report discrimination on at least one ground. 71

74 .. Knowledge of victims rights in the event of discrimination There is increasing knowledge of the rights of victims of discrimination The proportion of respondents who say they would know their rights should they fall victim to discrimination or harassment has increased considerably since 01: 5 answer yes, after a 8-point increase, while 7 answer that they would not know their rights (7, -1) 7. Six percent answer spontaneously that it depends (-6). Once again, the EU average conceals wide national differences in awareness. Knowledge of victims rights is most widespread in Finland (78), followed by Slovenia (66), Cyprus (6), Sweden (61), Ireland (59), the United Kingdom (58) and Lithuania (57). Overall, majorities of respondents say that they would know their rights if they were victims of discrimination or harassment in 1 countries (compared with 7 Member States in 01). Respondents are least likely to know their rights in Bulgaria (1), Austria () and Belgium (). Most countries have seen increases in awareness since the 01 survey (). The largest increases can be seen in Cyprus (+19 percentage points), Slovenia (+19), Lithuania 7 QC8: Would you know your rights if you were the victim of discrimination or harassment? 7

75 (+18) and Luxembourg (+17). The only countries where there have been decreases in awareness are Belgium (-), Denmark (-) and the Netherlands (-). In Sweden, awareness has remained stable. Awareness levels are generally no higher among members of groups at risk of discrimination. The exceptions are respondents who describe themselves as part of a minority with regards to sexual orientation (57 of whom say they would know their rights should they fall victim to discrimination or harassment) and members of a religious minority (50). Otherwise, awareness levels among groups at risk of discrimination are similar to the average figure. However, respondents with a diverse social circle are more likely than other people to know their rights (e.g. 50 of those who have friends or acquaintances who have disabilities and 57 of those who have friends or acquaintances who are transgender or transsexual). Previous experience of discrimination has only a minor influence on awareness: 8 of those who have experienced discrimination or harassment in the previous 1 months say they would know their rights, compared with of other respondents. There are differences between socio-demographic groups. Levels of awareness rise the longer a respondent has spent in education, from among those who left education aged 15 or younger to 5 of those who left full-time education at the age of 0 or older. Awareness is also lower among respondents aged 55 or over (0 compared with 7-9 in younger age groups). 7

76 7
77 .. Where would Europeans prefer to report harassment or discrimination If Europeans were the victim of discrimination, they would prefer to contact the police If they were the victim of discrimination or harassment, respondents are most likely to say that they would prefer to report their case to the police (5). This is ahead of other options, such as an equal opportunities organisation (17) or a lawyer (17). Less than one in ten say they would prefer to report their case to trade unions (9), tribunals (6), NGOs or associations (5) or somewhere else () 8. Overall, the results are similar to those obtained in June 01, although the proportion favouring a lawyer has increased (+ percentage points), while the proportion who would prefer tribunals has decreased (- points). Respondents in Spain (51) and the Czech Republic (50) are most likely to say they would prefer to report their case to the police if they were victim of discrimination or harassment; overall, the police are the organisation that is chosen most frequently in 0 countries. 8 QC9: If you were the victim of discrimination or harassment, to whom would you prefer to report your case? ONE ANSWER ONLY. 75
 and Greece () are most likely to say they would go to a lawyer.")
78 A relatively high proportion of respondents would prefer to contact an equal opportunities organisation in Sweden (8), Lithuania (5), the Netherlands () and Latvia (). Overall, this item is mentioned in first position in six countries. Respondents in Germany (6) and Greece () are most likely to say they would go to a lawyer. Respondents in Denmark (7) and Finland () would prefer to report the case to trade unions: this item comes in first position in these two countries. 76
79 Many differences across socio-demographic groups are minor, though some notable variations can be highlighted. Women are slightly more likely than men to say they would contact the police (7 compared with ). Perhaps surprisingly, a preference for the police is also stronger among younger people ( of 15- year olds) and older people (8 of those aged 55 or over), rather than those in the middle age bands (0 of those aged 5-9 and of those aged 0-5). Respondents with a higher level of education are more likely to prefer an equal opportunities organisation ( of those who ended education at the age of 0 or above, falling to 9 of those who ended education by the age of 15), but are less likely to prefer to contact the police (6 rising to 6). The responses among members of groups at risk of discrimination are generally similar to other respondents. However, members of some groups are less likely to say they would prefer to contact the police; specifically, those who are part of a minority with regards to sexual orientation (9) and those from a minority in terms of disability (7). These respondents particularly those from a minority with regards to sexual orientation are more likely than other respondents to prefer an equal opportunities organisation (). Similarly, those who have experienced discrimination recently are also less likely to mention the police (0 for those who have experienced discrimination on multiple grounds vs. 6 for those who have not experienced discrimination) and more likely to mention equal opportunities organisations (1 vs. 17) and trade unions (1 vs. 9). 77
80 5. VIEWS ABOUT EQUAL OPPORTUNITIES IN EMPLOYMENT The European Union has a strong and long-standing commitment to combating discrimination in employment, founded on a solid legal framework. The principle of equal treatment in employment and training irrespective of gender, religion or belief, disability, ethnic origin, sexual orientation or age is ensured at EU level through the Employment Directive, the Racial Equality Directive and numerous gender laws. This section examines three aspects of equal opportunities in employment: factors which are seen as putting job applicants at a disadvantage; support for measures to foster diversity in the workplace; and perceptions as to whether enough is being done to promote diversity Factors that are perceived to put applicants for a job at a disadvantage (Older) age is most widely seen as a factor that could put job applicants at a disadvantage Many respondents continue to perceive that discrimination exists in recruitment practices. Substantial proportions of respondents identify a range of factors that are likely to lead to disadvantage. Over half (56, + percentage points since June 01) believe that a candidate s age, if over 55, would be a disadvantage. This is followed by a candidate s look, manner of dress or presentation (5, +7), skin colour or ethnic origin (6, +7), a disability (6, +6), general physical appearance (size, weight, face) (5, +8), way of speaking (6, +6), gender identity (, +15), expression of religion belief (, +10), sexual orientation (8, +9), gender (7, +5), name (19 + 5), age if under 0 years old (16, +) and the candidate s address (1, +) 9. There have been increases since the 01 survey in the proportions of respondents mentioning each and every criterion that may put one candidate at a disadvantage. The largest increase is in the proportion saying that a candidate s gender identity may put them at a disadvantage (+15 percentage points). Each criterion has an increase, indicating that respondents were selecting, on average, more criteria that would disadvantage a candidate than in previous surveys. As noted earlier in the report in relation to the perception of discrimination becoming more widespread, these increases might reflect a greater awareness among respondents about different forms of discrimination or a rise in the actual number of incidents. 9 QC In (OUR COUNTRY) when a company wants to hire someone and has the choice between two candidates with equal skills and qualifications, which of the following criteria may, in your opinion, put one candidate at a disadvantage? (MULTIPLE ANSWERS POSSIBLE) 78
.")
81 In most countries, age discrimination against people aged over 55 years is seen as the most common form of discrimination in recruitment practices. The proportion of respondents that say this may put a candidate at a disadvantage is highest in the Netherlands (78). Overall, the survey shows a high level of sensitivity in Sweden and the Netherlands regarding perceived disadvantages in the recruitment process. A high proportion of respondents in these countries mention the various forms of discrimination. In addition, many respondents in Finland mention a number of forms of discrimination (including being over 55 years old, skin colour or ethnic origin, disability and general appearance), as do respondents in France (look, skin colour or ethnic origin, appearance, way of speaking) and Cyprus (gender identity and sexual orientation). Respondents in Ireland are most likely to mention the address of the candidate (5 vs. 1 at the EU level). Perceived discrimination in recruitment tends to be less common among respondents in Bulgaria (with relatively low proportions mentioning a candidate s look, appearance, way of speaking or gender), Croatia (low proportions mention being over 55, look, skin colour or ethnic origin, disability and appearance), Latvia (skin colour or ethnic origin, general appearance, gender identity, sexual orientation and religious belief), Hungary (gender identity, sexual orientation and religious belief), and Poland (look, skin colour or ethnic origin, disability and way of speaking). 79

82 80
83 In most cases, respondents who are part of a particular group at risk of discrimination are more likely to say that candidates in that group may be at a disadvantage during recruitment. This is most apparent among respondents who classify themselves as part of a minority in terms of disability: 6 say that a candidate s disability may put them at a disadvantage, compared with 6 of respondents overall. There is also a large difference in relation to sexual identity: 9 of those who are part of a minority with regards to sexual orientation say that this is something that may disadvantage a candidate, compared with 8 of respondents overall. The same pattern also applies, though to a lower extent, to gender: 0 of women think that this may put a candidate at a disadvantage, compared with 5 of men. However, this is not really the case when it comes to age: those aged 55 or over are only slightly more likely than younger people to say that being aged 55 or over may be a disadvantage (57 compared with in younger age groups). Similarly, 19 of 15- year olds say that being under 0 years old may be a disadvantage, compared with 1-18 in other age groups. The socio-demographic analysis also shows that: Respondents who remained in full-time education until the age of 0 or older are more likely to believe that various factors put candidates at a disadvantage, compared with those who left full-time education at a younger age. The difference is most pronounced in relation to the expression of a religious belief (1 among those who finished education at the age of 0 or above, compared with 5 of those who ended education at the age of 15 or younger). There is a relationship between the perception that discrimination is widespread and the opinion that discrimination exists in the recruitment process. Respondents with a more diverse social circle are more likely to believe candidates would be at a disadvantage because of various characteristics. 5.. Support for measures to foster diversity in the workplace There continues to be widespread support for training and monitoring measures to foster diversity in the workplace Respondents were asked whether they support or oppose three measures in the workplace to foster diversity, involving training and monitoring. There is widespread support for these measures. More than three-quarters of respondents support training on diversity issues for employees and employers (80, +1 percentage point) and monitoring of recruitment procedures (77, +1), while a slightly lower proportion support monitoring the composition of the workforce (69, no change). 81
84 The proportion that opposes these measures ranges from 11 for training on diversity issues to 0 for monitoring the composition of the workforce 50. Overall support for these measures has remained constant since the 01 survey, although the proportion that totally support them (rather than somewhat support ) has increased by between and 5 percentage points. Analysis at national level reveals that overall each measure is supported by majorities of respondents in every Member States. However, some variations can be highlighted: taking the three measures together, levels of support are highest among respondents in the United Kingdom (between 85 and 9 support the three measures), Ireland (between 88 and 9), Cyprus (between 87 and 89) and Spain (between 8 and 89). Respondents in Sweden express strong support for training on diversity issues (90) and monitoring of recruitment procedures (86) but less for monitoring of the workforce composition (68). The lowest levels of support can be seen in Slovakia (55-61 support the three measures), Poland (5-60), and Slovenia (57-66). The largest increases in support since 01 can be found in Ireland (+15 percentage points or more on all measures), Cyprus (+11 for diversity training), Portugal (+10 for diversity training) and Austria (+1 for monitoring the workforce composition). The largest decreases can be observed in Slovenia and Slovakia (both -8 percentage points or more on all measures), the Czech Republic (-1 for monitoring recruitment 50 QC5: To what extent do you support or oppose each of the following measures in the work place to foster diversity? 1) Training on diversity issues for employees and employers. ) Monitoring the composition of the work-force to evaluate the representation of groups at risk of discrimination. ) Monitoring recruitment procedures to ensure that candidates from groups at risk of discrimination have the same opportunities as other candidates with equal skills and qualifications. 8
.")
85 procedures and -11 for monitoring the workforce composition), Luxembourg (-1 for monitoring the workforce composition and -10 for monitoring recruitment procedures) and Poland (-10 for diversity training). * NA= Not asked: this question was not asked in this country during the previous survey Socio-demographic analysis shows that women are slightly more likely than men to support the three measures (for example, 81 compared with 77 for diversity 8
86 training). Older respondents (aged 55 or over) are less likely to support the measures, although this is partly due to a higher proportion of don t know responses in this group. There are few differences according to level of education or occupational status among those currently working. Respondents who belong to a group at risk of discrimination are generally more likely to support the measures, particularly those who are part or a minority with regards to sexual orientation or an ethnic minority. However, this does not apply to those who describe themselves as part of a minority in terms of disability, whose findings are no different to the average. Respondents with a diverse social circle are also more likely to support the measures. Overall, these measures are supported by large proportions of respondents in the different socio-demographic categories. 5.. Perception as to whether enough is being done to promote diversity in the workplace European workers have become more confident in what is being done to promote diversity in the workplace Respondents were asked whether they think enough is being done in their workplace to promote diversity in relation to various groups at risk of discrimination. More than half of respondents (mainly those not employed in a workplace) spontaneously said that the questions were not applicable to them. In the results below, the not applicable responses have been excluded and the percentages have been recalculated on the basis of the remaining respondents QC7: Do you think that enough is being done to promote diversity in your work place as far as each of the following is concerned? 1) Ethnic origin ) Gender ) Sexual orientation (being gay, lesbian or bisexual) ) Age, for people over 55 years old 5) Age, for people under 0 years olds 6) Religion or beliefs 7) Disability 8) Gender identity (being transgender or transsexual). 8
 and in terms of gender (58 vs. 6). This feeling is less widespread on the questions of ethnic origin (50 vs. ), religion and beliefs (9 vs. 0), disability (9 vs.")
87 Does not include the "Not applicable" respondents More than half of European workers feel that enough is being done to promote diversity in their workplace for young people (58 vs. who think it s not the case) and in terms of gender (58 vs. 6). This feeling is less widespread on the questions of ethnic origin (50 vs. ), religion and beliefs (9 vs. 0), disability (9 vs. 6) and people over 55 years old (7 vs. 9). Opinion is more divided when it comes to whether enough is being done in relation to sexual orientation ( vs. 5). Finally, a minority of respondents consider that enough is being done to promote gender identity in the work place ( vs. 0). On each of the characteristics, between 10 and 1 of respondents said spontaneously that there is no need to promote diversity in the workplace. Compared with the 01 survey, European workers are now more likely to think that enough is being done to promote diversity in their workplace. The proportion that say this has increased by between 5 and 9 percentage points for almost all characteristics: being under 0 years old (+9 percentage points), gender (+9), religion or beliefs (+9), being over 55 years old (+7), ethnic origin (+5), sexual orientation (+5) and disability (+). The exception is gender identity where there has been no change. There has also been an increase in the proportion of respondents who say spontaneously that there is no need to promote diversity, and this applies to all of the groups. Analysis by country shows that respondents in the United Kingdom are most likely to say that enough is being done to promote diversity in their workplace, and this applies across all of the various characteristics (at least 6 say enough is being done in each case). High proportions can also be seen in Ireland (5 of more for each of the characteristics), Denmark (high proportions for age (71 for people under 0 years old, and 60 for people over 55 years old), gender (7) and ethnic origin (6)) and Malta (high proportions for gender (70), religion or beliefs (60), disability (61), sexual orientation (6) and gender identity ()). 85
, Poland (no more than 6), Estonia (no more than 1) and Portugal (no more than 6).")
88 By contrast, respondents in the following countries are least likely to think that enough is being done: Bulgaria (no more than for any of the characteristics), Poland (no more than 6), Estonia (no more than 1) and Portugal (no more than 6). Does not include the "Not applicable" respondents 86
89 Findings are generally stable across different socio-demographic groups. The following differences can be observed: Analysis by occupation shows that managers are more likely to think that enough is being done in their workplace, compared with other occupational groups. For example, 8 of managers say that enough is being done in relation to sexual orientation, compared with 1 of other white collars and 9 of manual workers. Respondents who are part of the group at risk of discrimination in question are often more likely to say that enough is being done. This applies to members of an ethnic minority group, religious minority and minority with regards to sexual orientation (in relation to both sexual orientation and gender identity). However, this does not apply to those who describe themselves as part of a minority in terms of disability, younger or older people, and women, where findings are similar to the average for the relevant characteristic. Respondents with a diverse social circle are more likely to think that enough is being done in relation to the various characteristics. 87

90 6. MEASURES AND POLICIES TO FIGHT DISCRIMINATION This last section focuses on measures and policies to fight discrimination. It covers respondents perceptions of national policies to fight discrimination, the need to introduce new measures for fighting discrimination, and views on whether groups at risk of discrimination are excluded from measures aimed at addressing the economic crisis. It also examines respondents willingness to provide sensitive personal information relating to minority characteristics, and attitudes towards diversity information being provided at school The perceived effectiveness of national efforts to fight discrimination Views are mixed as to whether national efforts to fight discrimination are effective, although views have become more positive since the last survey Respondents were asked to rate the effectiveness of efforts made in their country to fight all forms of discrimination, using a scale from 1 to Respondents give a range of views on this issue: overall, 7 believe the efforts made are effective (points 7 to 10 on the scale) while 6 consider the efforts to be moderately effective (points 5 and 6 on the scale) and 6 say that these measures are ineffective (giving a score from 1 to on the scale); a further 5 say spontaneously that no efforts are made in their country. 5 QC6 Using a scale from 1 to 10, please tell me if you think that the efforts made in (OUR COUNTRY) to fight all forms of discrimination are effective. 1 means you consider that these efforts are not at all effective, and 10 that you consider that these efforts are very effective. 88
.")
91 Views have become more positive since the 01 survey, with an increase in the proportion saying efforts are effective (from up to 7). Meanwhile, the proportion of respondents who consider that these efforts are not effective has decreased (from 1 down to 6). Analysis at national level shows that respondents are most likely to say that national efforts to fight discrimination are effective in Malta (5 effective), Ireland () and Luxembourg (1), while the lowest proportions can be seen in Bulgaria (11), Latvia (1) and Estonia (15). In a number of countries, there have been large increases since 01 in the proportion who think national efforts to fight discrimination are effective: Ireland (+15 percentage points), Greece (+15), Hungary (+15), Malta (+1) and Finland (+10). Decreases can be seen in just three countries: Bulgaria (-6), Slovenia (-) and Estonia (-). Findings are generally stable across different socio-demographic groups. Men are slightly more likely than women to think that national efforts are effective (9 compared with 5), but there are only small differences by age or level of education. Respondents who describe themselves as part of a religious minority (5), a minority with regards to sexual orientation () or an ethnic minority (1) are more likely than other respondents to say that efforts are effective, but the proportion of those who say they are part of a minority in terms of disability (5) is similar to the average figure. People who have been discriminated against themselves tend to be more critical of national efforts to fight discrimination. A third () say that efforts are not effective, compared with of those who have not experienced discrimination. In general, people who think discrimination is widespread in their country tend to be more critical of national efforts to fight discrimination. 89

92 6.. Is there a need for new measures to fight discrimination? The majority of respondents favour new measures to protect groups at risk of discrimination Respondents were presented with two options for dealing with discrimination in areas such as access to goods and services, social protection or education. The majority of respondents (6) say that new measures should be introduced to raise the level of protection for groups at risk of discrimination, while 7 think that new measures are not necessary; 11 answer that they don t know 5. There is important variation between countries. In Cyprus (89) and Malta (86), a high proportion of respondents think that new measures should be introduced to raise the level of protection for groups at risk of discrimination, with relatively high proportions also seen in Portugal (76), Greece (76), Spain (75) and Sweden (7). Respondents are least likely to favour new measures in Slovenia (7), Poland (8), Slovakia (51), the Netherlands (51), Estonia (5) and Austria (5). 5 QC10: People may be discriminated against on the grounds of disability, age, religion or beliefs, sexual orientation or gender identity in areas such as access to goods and services, social protection (health or housing services) or education. Which of the following two statements comes closest to your view? 90

93 Overall, in all countries, majorities of respondents consider that new measures to raise the level of protection of these groups at risk of discrimination should be introduced. Looking at socio-demographic variations, women are more likely than men to say that new measures should be introduced to raise the level of protection for groups at risk of discrimination (67 compared with 58), while younger people are more likely than older people to say this (71 of 15- year olds, falling to 56 of those aged 55 or over). Respondents living in large towns are also slightly more likely than those in rural areas to think new measures are needed (65 compared with 60). 91

94 9
95 6.. Are some groups excluded from measures and policies to fight the crisis? Older and people with disabilities are the main groups that are thought to have been excluded from measures to fight the economic crisis Respondents were asked whether they thought measures to fight the economic crisis in their country are excluding people from groups at risk of discrimination. Around half of respondents think that national policies are excluding people over 55 years old (5), while 6 think people with a disability are being excluded. In both cases, the proportion saying that the group is excluded ( yes, definitely or yes, to some extent ) is greater than the proportion saying the group is not being excluded ( no, not really or no, definitely not ). However, respondents are less likely to say that other groups are being excluded: people from ethnic minorities (0), transgender or transsexual people (), gay, lesbian or bisexual people (1), religious minorities (1) and people aged under 0 (1) 5. The country analysis shows that respondents in Spain are most likely to think that measures to fight the economic crisis and policies to promote recovery are excluding people over 55 years old (75) and people under 0 years old (50). The proportion is also highest in Spain in relation to people from ethnic or religious minorities (5 and 1 respectively). A high proportion of respondents in Greece think that various groups have been excluded by measures aimed at fighting the economic crisis, in particular people with a disability (6) and transgender or transsexual people (51). 5 Do you think that in (OUR COUNTRY) measures to fight the economic crisis and policies to promote recovery are excluding people from each of the following groups? 1) People from a different ethnic origin than the majority of the population ) People with a different sexual orientation than the majority of the population (gay, lesbian or bisexual) ) People over 55 years olds ) People under 0 years old 5) People from a different religion than the majority of the population 6) People with a disability 7) Transgender or transsexual people. 9
.")
96 Respondents in Portugal are most likely to say that gay, lesbian or bisexual people are being excluded from measures to fight the economic crisis and policies to promote recovery (6), while the figures are among the highest in Finland for a number of groups (people with a disability, ethnic minorities and people under 0 years old). Respondents are least likely to think that groups at risk of discrimination are being excluded from measures to fight the economic crisis and policies to promote recovery in Estonia (with the lowest proportions in relation to people over 55 years old, transgender or transsexual people and religious minorities), Luxembourg (lowest proportions for people with a disability and ethnic minorities), Denmark (lowest proportion for people over 55 years old) and Latvia (lowest proportion for religious minorities). 9
97 Results are generally quite homogeneous among the different socio-demographic groups. Some differences can be highlighted though: People reporting to belong to a group at risk of discrimination are more likely to think that the group in question is excluded by measures to fight the economic crisis and policies to promote recovery. This includes respondents from an ethnic minority (50), a religious minority (1), a minority with regards to sexual orientation (9 in relation to transgender or transsexual people and 5 in relation to gay, lesbian or bisexual people) and those from a minority in terms of disability (57). However, there is no difference among younger or older respondents in relation to their own age groups being excluded. Respondents who said that they have felt discriminated against or harassed in the past 1 months are more likely to feel that the various groups are being excluded, and this applies in particular to respondents who say they have experienced multiple forms of discrimination. For example, 7 of respondents who have not experienced any discrimination in the previous 1 months say that people from ethnic minority group are being excluded, and this rises to 5 among those who have experienced discrimination on a single ground and 55 among those who have experienced it on multiple grounds. 95
98 6.. The willingness to provide sensitive personal information - There is broad support for providing sensitive personal information on an anonymous basis Respondents express support for providing personal details on an anonymous basis if it could help to combat discrimination in their country. Respondents are most in favour of providing information on their ethnic origin (7 totally or somewhat in favour ) and on their religion or beliefs (71), while they are slightly less positive about providing information on their health situation (66 in favour) and their sexual orientation (6). In each case, between and 0 of respondents are opposed to giving this type of information. The same question was asked in June-July 006 (65.), and there has been little change in the findings since then. The proportions in favour of providing this type of information have decreased slightly, with the largest decrease in relation to providing health information (down from 71 in favour in 006 to 66 in 015) 55. However, the proportion of respondents answered they are totally in favour has risen in each item, suggesting that opinions are becoming stronger on this issue. Respondents in the following countries are most likely to be in favour of providing personal information on an anonymous basis: Malta (8 or more are in favour of providing each of the four types of information), Denmark (81 or more), the United Kingdom (80 or more) and Sweden (78 or more). By contrast, respondents are least likely to be in favour of providing this type of information in Hungary (no more than 5 are in favour of providing each of the four types of information), Slovenia (no more than 5) and Poland (no more than 5). 55 QC11. Are you in favour of or opposed to providing, on an anonymous basis, information about as part of a census, if that could help to combat discrimination in (OUR COUNTRY)? 1) Your ethnic origin ) Your religion or beliefs ) Your health situation ) Your sexual orientation. 96
, Slovakia (-18 or more), Poland (-16 or more), the Czech Republic (-15 or more), Bulgaria (-1 or more), Belgium (-10 or more) and Hungary (-8 or more).")
99 In some countries, there have been large decreases since the 006 survey in the proportion in favour of providing personal information: Slovenia (-18 or more for each of the four types of information), Slovakia (-18 or more), Poland (-16 or more), the Czech Republic (-15 or more), Bulgaria (-1 or more), Belgium (-10 or more) and Hungary (-8 or more). The largest increases can be seen in Ireland (+9 or more), Cyprus (+5 or more), Austria (+5 or more) and Luxembourg (+ or more). * NA= Not asked: this question was not asked in this country during the previous survey 97
100 There are variations between socio-demographic groups. Younger people are more likely to be in favour of providing the various types of information, with the largest difference for providing information on sexual orientation (71 of 15- year olds, compared with 57 of those aged 55 or over). More highly educated respondents are also more likely to be in favour; for example 75 of those who ended education at the age of 0 or older are in favour of providing information on ethnic origin, falling to 67 among those who left education at the age of 15 or younger. This pattern applies to all of the types of information except for health situation, where there is no difference by level of education. Importantly, respondents who describe themselves as belonging to a group at risk of discrimination are more likely to be willing to provide personal information. This applies both to information on their own minority characteristic (e.g. respondents from a minority with regards to sexual orientation are more likely than other respondents to be in favour of providing details on their sexual orientation), as well as to other types of information (e.g. respondents from a religious minority are also more likely than the overall average to be in favour of providing information on sexual orientation). This pattern applies to respondents from an ethnic, religious and to a minority with regards to sexual orientation, but not to those from a minority in terms of disability (whose figures are similar to the average). People who have experienced discrimination are also more likely to be in favour of providing the different types of information. For example, 78 of those who have been discriminated against on multiple grounds are in favour of providing information on religion or beliefs, as are 75 of those who experienced discrimination on a single ground, compared with 69 of those who have not experienced discrimination. In general, respondents with a diverse social circle are more likely to be in favour of providing personal information, as are those who believe that discrimination is widespread in their country. 98

101 99
102 6.5. Should school lessons and material include information about diversity? The majority of respondents agree that diversity information should be provided at school Most respondents agree that school lessons and material should include information about diversity, particularly in terms of ethnic origin (81 agree vs. 1 disagree) and religion or beliefs (80 vs. 15). Respondents are slightly less likely to agree that information about sexual orientation (67) and gender identity (6) should be included; in each case, more than a quarter (7 and 9 respectively) disagree that school lessons and material should include diversity information on these issues 56. In three countries, a high proportion of respondents agree that school lessons and material should include information about diversity, in terms of all of the characteristics included in the question: Sweden (at least 9 agree in relation to each of the characteristics), the Netherlands (at least 8) and Cyprus (at least 78). By contrast, a low proportion of respondents agree with including diversity information in school lessons and material - particularly in relation to sexual orientation and gender identity - in Romania (5 and respectively), Slovakia (8 and 5), Bulgaria (9 and 8), Latvia (51 and 9) and Lithuania (7 in each case). Low proportions agree with providing information about ethnic origin and religion or beliefs in the Czech Republic (71 and 68 respectively), France (71 and 66), Hungary (67 and 70), Slovenia (71 in each case) and Poland (71 and 7). 56 QC17: And to what extent do you agree or disagree with each of the following statements? School lessons and material should include information about diversity in terms of 1)Religion or beliefs ) Ethnic origin ) Sexual orientation (being gay, lesbian or bisexual people) ) Gender identity (being transgender or transsexual people). 100
 are less likely to agree that diversity information should be provided at school.")
103 The variations between socio-demographic groups are similar to those seen in previous questions. Older people (aged 55 or over) are less likely to agree that diversity information should be provided at school. For example, 76 of those aged 55 or over agree that diversity information should be provided in terms of ethnic origin, compared with 8-8 in younger age groups. More highly educated respondents are also more likely to agree; for example 7 of those who ended education at the age of 0 or older agree in relation to information on 101
104 sexual orientation, falling to 57 among those who left education at the age of 15 or younger. Respondents who describe themselves as being part of a minority with regards to sexual orientation are much more likely than other respondents to agree that information should be provided about sexual orientation (8 vs. 67 overall) and gender identity (81 vs. 6 overall). Similarly, respondents who report being from an ethnic minority are slightly more likely to agree with information on ethnic origin being provided in school lessons (8 vs. 81 overall), and respondents who report being a part of a religious minority are slightly more likely to agree with information on religion or beliefs being provided (8 vs. 80 overall). In general, respondents with a diverse social circle are more likely to agree with information about diversity being provided at school. However, there is little difference with respondents attitudes depending on whether or not the respondent lives in a household with children. 10
105 CONCLUSIONS This new Eurobarometer survey builds on previous Eurobarometer surveys 57 that have measured the opinions and perceptions of Europeans on issues and public policies that relate to discrimination. This section draws together the main findings from the 015 survey. Increasingly tolerant attitudes towards groups at risk of discrimination, although with great differences between EU countries. The survey indicates that Europeans are becoming more comfortable towards groups at risk of discrimination. This is shown by the increasing proportion who are at ease (comfortable or indifferent) with having someone from a group at risk of discrimination in the highest political position in their country. The survey shows increases of between 7 and 1 percentage points since 01 for the various groups at risk of discrimination covered in the survey. In addition, the majority of respondents say they would be at ease working with someone from a group at risk of discrimination, and with one of their sons or daughters having a relationship with someone from a group at risk of discrimination. Levels of social acceptance vary in relation to different groups at risk of discrimination. In particular, respondents are less tolerant towards Muslim people, Roma people and transgender and transsexual people. Respondents are more at ease with having a member of a group at risk of discrimination as a colleague than having a member of a group at risk of discrimination in a relationship with their son or daughter. The levels to which respondents are at ease between these two situations sometimes vary significantly. There is also considerable variation by country in attitudes towards groups at risk of discrimination. The disparity in attitudes among Member States is greater for questions that are closer to personal situations: for example, the differences among countries in comfort levels with having a son or daughter who is in a relationship with someone from a group at risk of discrimination tend to be larger than differences in comfort levels with working with someone from a group at risk of discrimination. Additionally, with specific regards to sexual orientation and gender identity, the polarisation of attitudes among Member States is particularly high. There are also variations by socio-demographic characteristics, with younger people and those who remained longer in full-time education more likely to express tolerant views. As noted in previous surveys, the degree of diversity in respondents social circles has a marked relationship on their awareness of discrimination, as well as levels of tolerance towards groups at risk of discrimination. Throughout the survey, respondents who have 57 Previous surveys conducted in 006, 009 and
106 friends or acquaintances in different groups at risk of discrimination are more likely to be comfortable with different scenarios involving groups at risk of discrimination, and to support measures that promote equal opportunities. Social circles of Europeans are becoming steadily more diverse. More than twothirds of respondents have friends or acquaintances who are of a different religion or have different beliefs to them (70), a continuing increase from previous surveys. This might also suggest more openness from the respondents with regards to groups at risk of discrimination. There are still wide variations between Member States on attitudes towards LGBT people Social acceptance of LGBT people varies a lot among countries. In some Member States, large majorities of respondents would feel at ease if a person from this group were elected at the highest political position; if they were working with a LGBT person or if their son or daughter was in a love relationship with a person of the same sex or a transgender or transsexual person. This is especially the case in Sweden, the Netherlands, Ireland and Denmark. At the other hand of the scale, levels of comfort are much lower in Slovakia, Romania, Bulgaria, and Lithuania. Beyond social acceptance, more than seven in ten respondents (71) agree that LGBT people should have the same rights as heterosexual people. A significant increase can be seen in the agreement that same-sex marriages should be allowed throughout Europe, compared with a similar question asked in 006. Moreover, respondents are strongly supportive of transgender and transsexual people being able to change their civil documents to match their inner gender identity. However, there is still wide variation between countries on these issues. Increasing awareness of rights More than four respondents in ten (5) say they would know their rights should they be a victim of discrimination or harassment, an improvement on the 01 figure (7). Europeans continue to say that they would prefer to report their case to the police should they become a victim of discrimination or harassment, rather than other options such as tribunals or organisations such as equality bodies and previous experience of discrimination has only a minor influence on the level of awareness. Support for measures that promote workplace diversity Respondents are very supportive of measures to foster diversity in the workplace, including training on diversity issues, monitoring of recruitment procedures and monitoring of the workforce composition. There has also been an increase since 01 in the proportion who think enough is being done in their workplace to promote diversity. At the same time, most respondents still perceive that discrimination exists in recruitment practices. 10
107 Assessment of efforts to fight discrimination Many Europeans are quite critical in their assessment of the effectiveness of national efforts to fight discrimination: 7 of respondents believe the efforts made in their country are effective, although this is an increase on the 01 figure of. Reflecting these results, the majority of respondents think that new measures need to be introduced to raise the level of protection for groups at risk of discrimination. Specifically, older and people with disabilities are the main groups that are thought to have been excluded from measures to fight the economic crisis and policies to promote recovery. Most respondents say they would provide sensitive personal information if this could help combat discrimination in their country, and the majority are in favour of information about diversity being provided at school. These views reflect the respondent's concern that more still needs to be done to protect the rights of groups at risk of discrimination. 105
108 ANNEXES
109 TECHNICAL SPECIFICATIONS
110 SPECIAL EUROBAROMETER 7 Discrimination TECHNICAL SPECIFICATIONS Between the 0 th of May and the 8 th of June 015, TNS opinion & social, a consortium created between TNS political & social, TNS UK and TNS opinion, carried out the wave of the EUROBAROMETER survey, on request of the EUROPEAN COMMISSION, Directorate-General for Communication, Strategy, Corporate Communication Actions and Eurobarometer unit. The SPECIAL EUROBAROMETER 7 is part of wave and covers the population of the respective nationalities of the 8 European Union Member States, resident in each of the Member States and aged 15 years and over. The basic sample design applied in all states is a multi-stage, random (probability) one. In each country, a number of sampling points was drawn with probability proportional to population size (for a total coverage of the country) and to population density. In order to do so, the sampling points were drawn systematically from each of the "administrative regional units", after stratification by individual unit and type of area. They thus represent the whole territory of the countries surveyed according to the EUROSTAT NUTS II (or equivalent) and according to the distribution of the resident population of the respective nationalities in terms of metropolitan, urban and rural areas. In each of the selected sampling points, a starting address was drawn, at random. Further addresses (every Nth address) were selected by standard "random route" procedures, from the initial address. In each household, the respondent was drawn, at random (following the "closest birthday rule"). All interviews were conducted face-to-face in people's homes and in the appropriate national language. As far as the data capture is concerned, CAPI (Computer Assisted Personal Interview) was used in those countries where this technique was available. For each country a comparison between the sample and the universe was carried out. The Universe description was derived from Eurostat population data or from national statistics offices. For all countries surveyed, a national weighting procedure, using marginal and intercellular weighting, was carried out based on this Universe description. In all countries, gender, age, region and size of locality were introduced in the iteration procedure. For international weighting (i.e. EU averages), TNS Opinion & Social applies the official population figures as provided by EUROSTAT or national statistic offices. The total population figures for input in this post-weighting procedure are listed below. TS1
111 Readers are reminded that survey results are estimations, the accuracy of which, everything being equal, rests upon the sample size and upon the observed percentage. With samples of about 1,000 interviews, the real percentages vary within the following confidence limits: Statistical Margins due to the sampling process (at the 95 level of confidence) various sample sizes are in rows various observed results are in columns N=50 6,0 8, 9,9 11,1 1,0 1,7 1, 1,6 1,8 1,9 N=50 N=500 1,9,6,1,5,8,0,,,, N=500 N=1000 1, 1,9,,5,7,8,0,0,1,1 N=1000 N=1500 1,1 1,5 1,8,0,,,,5,5,5 N=1500 N=000 1,0 1, 1,6 1,8 1,9,0,1,1,, N=000 N=000 0,8 1,1 1, 1, 1,5 1,6 1,7 1,8 1,8 1,8 N=000 N=000 0,7 0,9 1,1 1, 1, 1, 1,5 1,5 1,5 1,5 N=000 N=5000 0,6 0,8 1,0 1,1 1, 1, 1, 1, 1, 1, N=5000 N=6000 0,6 0,8 0,9 1,0 1,1 1, 1, 1, 1, 1, N=6000 N=7000 0,5 0,7 0,8 0,9 1,0 1,1 1,1 1,1 1, 1, N=7000 N=7500 0,5 0,7 0,8 0,9 1,0 1,0 1,1 1,1 1,1 1,1 N=7500 N=8000 0,5 0,7 0,8 0,9 0,9 1,0 1,0 1,1 1,1 1,1 N=8000 N=9000 0,5 0,6 0,7 0,8 0,9 0,9 1,0 1,0 1,0 1,0 N=9000 N= , 0,6 0,7 0,8 0,8 0,9 0,9 1,0 1,0 1,0 N=10000 N= , 0,6 0,7 0,7 0,8 0,9 0,9 0,9 0,9 0,9 N=11000 N=1000 0, 0,5 0,6 0,7 0,8 0,8 0,9 0,9 0,9 0,9 N=1000 N=1000 0, 0,5 0,6 0,7 0,7 0,8 0,8 0,8 0,9 0,9 N=1000 N=1000 0, 0,5 0,6 0,7 0,7 0,8 0,8 0,8 0,8 0,8 N=1000 N= , 0,5 0,6 0,6 0,7 0,7 0,8 0,8 0,8 0,8 N= TS
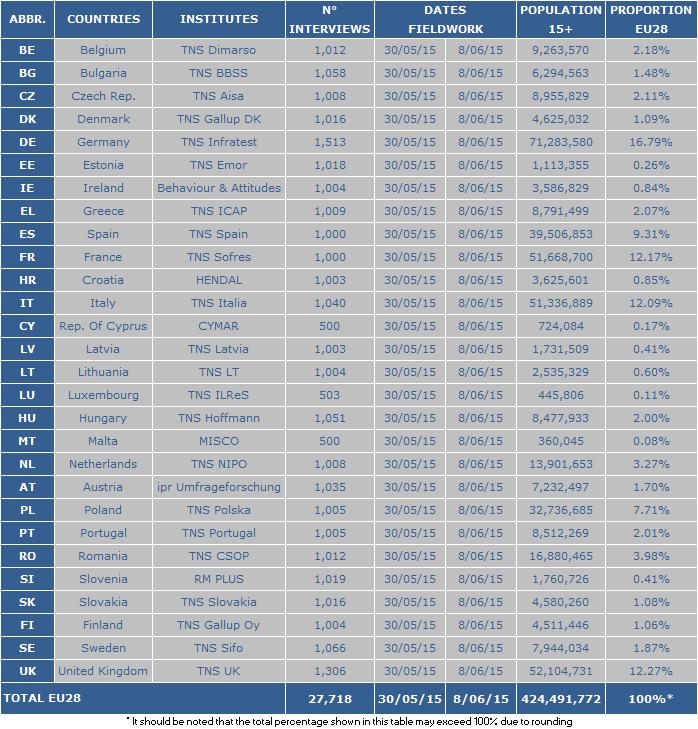
112 TS
DISCRIMINATION IN THE EU IN 2012
 Special Eurobarometer 393 DISCRIMINATION IN THE EU IN 2012 REPORT Fieldwork: June 2012 Publication: November 2012 This survey has been requested by the European Commission, Directorate-General Justice
Funktion der Mindestreserve im Bezug auf die Schlüsselzinssätze der EZB (German Edition)
") Funktion der Mindestreserve im Bezug auf die Schlüsselzinssätze der EZB (German Edition) Philipp Heckele Click here if your download doesn"t start automatically Download and Read Free Online Funktion
Funktion der Mindestreserve im Bezug auf die Schlüsselzinssätze der EZB (German Edition) Philipp Heckele Click here if your download doesn"t start automatically Download and Read Free Online Funktion
Wie man heute die Liebe fürs Leben findet
 Wie man heute die Liebe fürs Leben findet Sherrie Schneider Ellen Fein Click here if your download doesn"t start automatically Wie man heute die Liebe fürs Leben findet Sherrie Schneider Ellen Fein Wie
Die Bedeutung neurowissenschaftlicher Erkenntnisse für die Werbung (German Edition)
") Die Bedeutung neurowissenschaftlicher Erkenntnisse für die Werbung (German Edition) Lisa Johann Click here if your download doesn"t start automatically Download and Read Free Online Die Bedeutung neurowissenschaftlicher
Die Bedeutung neurowissenschaftlicher Erkenntnisse für die Werbung (German Edition) Lisa Johann Click here if your download doesn"t start automatically Download and Read Free Online Die Bedeutung neurowissenschaftlicher
Inequality Utilitarian and Capabilities Perspectives (and what they may imply for public health)
") Inequality Utilitarian and Capabilities Perspectives (and what they may imply for public health) 1 Utilitarian Perspectives on Inequality 2 Inequalities matter most in terms of their impact onthelivesthatpeopleseektoliveandthethings,
Inequality Utilitarian and Capabilities Perspectives (and what they may imply for public health) 1 Utilitarian Perspectives on Inequality 2 Inequalities matter most in terms of their impact onthelivesthatpeopleseektoliveandthethings,
Call Centers and Low Wage Employment in International Comparison
 Wissenschaftszentrum Nordrhein-Westfalen Kulturwissenschaftliches Institut Wuppertal Institut für Klima, Umwelt, Energie Institut Arbeit und Technik Call Centers and Low Wage Employment in International
Ein Stern in dunkler Nacht Die schoensten Weihnachtsgeschichten. Click here if your download doesn"t start automatically
 Ein Stern in dunkler Nacht Die schoensten Weihnachtsgeschichten Click here if your download doesn"t start automatically Ein Stern in dunkler Nacht Die schoensten Weihnachtsgeschichten Ein Stern in dunkler
prorm Budget Planning promx GmbH Nordring Nuremberg
 prorm Budget Planning Budget Planning Business promx GmbH Nordring 100 909 Nuremberg E-Mail: support@promx.net Content WHAT IS THE prorm BUDGET PLANNING? prorm Budget Planning Overview THE ADVANTAGES OF
Mobility trends in the Baltic Sea Region
 Mobility trends in the Baltic Sea Region Conference on promoting strategic and innovative mobility for students and researchers 23 November 2010 in Copenhagen by Dr. Birger Hendriks Outline Forms of mobility
Level 1 German, 2014
 90886 908860 1SUPERVISOR S Level 1 German, 2014 90886 Demonstrate understanding of a variety of German texts on areas of most immediate relevance 9.30 am Wednesday 26 November 2014 Credits: Five Achievement
THE POLISH VIEW ON GERMAN-POLISH PARTNERSHIP IN A COMMON EUROPE
 Agnieszka Łada GERMAN-POLISH BAROMETER 2015 THE POLISH VIEW ON GERMAN-POLISH PARTNERSHIP IN A COMMON EUROPE MAIN CONCLUSIONS Without any change for a couple of years the Poles evaluate the German European
Was heißt Denken?: Vorlesung Wintersemester 1951/52. [Was bedeutet das alles?] (Reclams Universal-Bibliothek) (German Edition)
![Was heißt Denken?: Vorlesung Wintersemester 1951/52. [Was bedeutet das alles?] (Reclams Universal-Bibliothek) (German Edition)](/thumbs/68/59244907.jpg "Was heißt Denken?: Vorlesung Wintersemester 1951/52. [Was bedeutet das alles?] (Reclams Universal-Bibliothek) (German Edition)") Was heißt Denken?: Vorlesung Wintersemester 1951/52. [Was bedeutet das alles?] (Reclams Universal-Bibliothek) (German Edition) Martin Heidegger Click here if your download doesn"t start automatically Was
Was heißt Denken?: Vorlesung Wintersemester 1951/52. [Was bedeutet das alles?] (Reclams Universal-Bibliothek) (German Edition) Martin Heidegger Click here if your download doesn"t start automatically Was
Women Entrepreneurship in Germany and Access to Capital
 Summary Slide Women Entrepreneurship in Germany and Access to Capital Women Entrepreneurship in Germany and Access to Capital Presentation at ESTRAD Lecture Exploring Growth Financing for Women Entrepreneurs,
Level 2 German, 2013
 91126 911260 2SUPERVISOR S Level 2 German, 2013 91126 Demonstrate understanding of a variety of written and / or visual German text(s) on familiar matters 9.30 am Monday 11 November 2013 Credits: Five
Willy Pastor. Click here if your download doesn"t start automatically
 Albrecht Dürer - Der Mann und das Werk (Vollständige Biografie mit 50 Bildern): Das Leben Albrecht Dürers, eines bedeutenden Künstler (Maler, Grafiker... und der Reformation (German Edition) Willy Pastor
Level 2 German, 2016
 91126 911260 2SUPERVISOR S Level 2 German, 2016 91126 Demonstrate understanding of a variety of written and / or visual German texts on familiar matters 2.00 p.m. Tuesday 29 November 2016 Credits: Five
Wer bin ich - und wenn ja wie viele?: Eine philosophische Reise. Click here if your download doesn"t start automatically
 Wer bin ich - und wenn ja wie viele?: Eine philosophische Reise Click here if your download doesn"t start automatically Wer bin ich - und wenn ja wie viele?: Eine philosophische Reise Wer bin ich - und
FACHKUNDE FüR KAUFLEUTE IM GESUNDHEITSWESEN FROM THIEME GEORG VERLAG
 FACHKUNDE FüR KAUFLEUTE IM GESUNDHEITSWESEN FROM THIEME GEORG VERLAG DOWNLOAD EBOOK : FACHKUNDE FüR KAUFLEUTE IM GESUNDHEITSWESEN Click link bellow and free register to download ebook: FACHKUNDE FüR KAUFLEUTE
Mock Exam Behavioral Finance
 Mock Exam Behavioral Finance For the following 4 questions you have 60 minutes. You may receive up to 60 points, i.e. on average you should spend about 1 minute per point. Please note: You may use a pocket
Die Intrige: Historischer Roman (German Edition)
") Die Intrige: Historischer Roman (German Edition) Ehrenfried Kluckert Click here if your download doesn"t start automatically Die Intrige: Historischer Roman (German Edition) Ehrenfried Kluckert Die Intrige:
Die Intrige: Historischer Roman (German Edition) Ehrenfried Kluckert Click here if your download doesn"t start automatically Die Intrige: Historischer Roman (German Edition) Ehrenfried Kluckert Die Intrige:
FIVNAT-CH. Annual report 2002
 FIVNAT-CH Schweizerische Gesellschaft für Reproduktionsmedizin Annual report 2002 Date of analysis 15.01.2004 Source: FileMaker Pro files FIVNAT_CYC.FP5 and FIVNAT_PAT.FP5 SUMMARY TABLE SUMMARY RESULTS
Hardwarekonfiguration an einer Siemens S7-300er Steuerung vornehmen (Unterweisung Elektriker / - in) (German Edition)
 (German Edition)") Hardwarekonfiguration an einer Siemens S7-300er Steuerung vornehmen (Unterweisung Elektriker / - in) (German Edition) Thomas Schäfer Click here if your download doesn"t start automatically Hardwarekonfiguration
Hardwarekonfiguration an einer Siemens S7-300er Steuerung vornehmen (Unterweisung Elektriker / - in) (German Edition) Thomas Schäfer Click here if your download doesn"t start automatically Hardwarekonfiguration
Die besten Chuck Norris Witze: Alle Fakten über den härtesten Mann der Welt (German Edition)
") Die besten Chuck Norris Witze: Alle Fakten über den härtesten Mann der Welt (German Edition) Click here if your download doesn"t start automatically Die besten Chuck Norris Witze: Alle Fakten über den
Die besten Chuck Norris Witze: Alle Fakten über den härtesten Mann der Welt (German Edition) Click here if your download doesn"t start automatically Die besten Chuck Norris Witze: Alle Fakten über den
DIBELS TM. German Translations of Administration Directions
 DIBELS TM German Translations of Administration Directions Note: These translations can be used with students having limited English proficiency and who would be able to understand the DIBELS tasks better
Im Fluss der Zeit: Gedanken beim Älterwerden (HERDER spektrum) (German Edition)
 (German Edition)") Im Fluss der Zeit: Gedanken beim Älterwerden (HERDER spektrum) (German Edition) Ulrich Schaffer Click here if your download doesn"t start automatically Im Fluss der Zeit: Gedanken beim Älterwerden (HERDER
Im Fluss der Zeit: Gedanken beim Älterwerden (HERDER spektrum) (German Edition) Ulrich Schaffer Click here if your download doesn"t start automatically Im Fluss der Zeit: Gedanken beim Älterwerden (HERDER
DAS ZUFRIEDENE GEHIRN: FREI VON DEPRESSIONEN, TRAUMATA, ADHS, SUCHT UND ANGST. MIT DER BRAIN-STATE-TECHNOLOGIE DAS LEBEN AUSBALANCIEREN (GE
 DAS ZUFRIEDENE GEHIRN: FREI VON DEPRESSIONEN, TRAUMATA, ADHS, SUCHT UND ANGST. MIT DER BRAIN-STATE-TECHNOLOGIE DAS LEBEN AUSBALANCIEREN (GE READ ONLINE AND DOWNLOAD EBOOK : DAS ZUFRIEDENE GEHIRN: FREI
Materialien zu unseren Lehrwerken
 Word order Word order is important in English. The word order for subjects, verbs and objects is normally fixed. The word order for adverbial and prepositional phrases is more flexible, but their position
EXPERT SURVEY OF THE NEWS MEDIA
 EXPERT SURVEY OF THE NEWS MEDIA THE SHORENSTEIN CENTER ON THE PRESS, POLITICS & PUBLIC POLICY JOHN F. KENNEDY SCHOOL OF GOVERNMENT, HARVARD UNIVERSITY, CAMBRIDGE, MA 0238 PIPPA_NORRIS@HARVARD.EDU. FAX:
Mitglied der Leibniz-Gemeinschaft
 Methods of research into dictionary use: online questionnaires Annette Klosa (Institut für Deutsche Sprache, Mannheim) 5. Arbeitstreffen Netzwerk Internetlexikografie, Leiden, 25./26. März 2013 Content
Benjamin Whorf, Die Sumerer Und Der Einfluss Der Sprache Auf Das Denken (Philippika) (German Edition)
 (German Edition)") Benjamin Whorf, Die Sumerer Und Der Einfluss Der Sprache Auf Das Denken (Philippika) (German Edition) Sebastian Fink Click here if your download doesn"t start automatically Benjamin Whorf, Die Sumerer
Benjamin Whorf, Die Sumerer Und Der Einfluss Der Sprache Auf Das Denken (Philippika) (German Edition) Sebastian Fink Click here if your download doesn"t start automatically Benjamin Whorf, Die Sumerer
Work-Life-Balance Issues in Germany Recent Developments
 Work-Life-Balance Issues in Germany Recent Developments Maresa Feldmann, TU Dortmund University Sozialforschungsstelle (sfs) Germany politics.co.uk Outline Legal requirements Different child care services
Nürnberg und der Christkindlesmarkt: Ein erlebnisreicher Tag in Nürnberg (German Edition)
") Nürnberg und der Christkindlesmarkt: Ein erlebnisreicher Tag in Nürnberg (German Edition) Karl Schön Click here if your download doesn"t start automatically Nürnberg und der Christkindlesmarkt: Ein erlebnisreicher
Nürnberg und der Christkindlesmarkt: Ein erlebnisreicher Tag in Nürnberg (German Edition) Karl Schön Click here if your download doesn"t start automatically Nürnberg und der Christkindlesmarkt: Ein erlebnisreicher
Die "Badstuben" im Fuggerhaus zu Augsburg
 Die "Badstuben" im Fuggerhaus zu Augsburg Jürgen Pursche, Eberhard Wendler Bernt von Hagen Click here if your download doesn"t start automatically Die "Badstuben" im Fuggerhaus zu Augsburg Jürgen Pursche,
Killy Literaturlexikon: Autoren Und Werke Des Deutschsprachigen Kulturraumes 2., Vollstandig Uberarbeitete Auflage (German Edition)
") Killy Literaturlexikon: Autoren Und Werke Des Deutschsprachigen Kulturraumes 2., Vollstandig Uberarbeitete Auflage (German Edition) Walther Killy Click here if your download doesn"t start automatically
Killy Literaturlexikon: Autoren Und Werke Des Deutschsprachigen Kulturraumes 2., Vollstandig Uberarbeitete Auflage (German Edition) Walther Killy Click here if your download doesn"t start automatically
»Diesel-Verkaufspreise in Europa Mai - May 2015
 »Diesel-Verkaufspreise in Europa Netto Preise net prices Durchschnittspreise auf Basis der DKV Transaktionen / Average prices based on DKV transactions Alle Angaben ohne Gewähr / All information without
»Diesel-Verkaufspreise in Europa Juli - July 2015
 »Diesel-Verkaufspreise in Europa Netto Preise net prices Durchschnittspreise auf Basis der DKV Transaktionen / Average prices based on DKV transactions Alle Angaben ohne Gewähr / All information without
»Diesel-Verkaufspreise in Europa April - April 2017
 »Diesel-Verkaufspreise in Europa Netto Preise net prices Durchschnittspreise auf Basis der DKV Transaktionen / Average prices based on DKV transactions Alle Angaben ohne Gewähr / All information without
Flow - der Weg zum Glück: Der Entdecker des Flow-Prinzips erklärt seine Lebensphilosophie (HERDER spektrum) (German Edition)
 (German Edition)") Flow - der Weg zum Glück: Der Entdecker des Flow-Prinzips erklärt seine Lebensphilosophie (HERDER spektrum) (German Edition) Mihaly Csikszentmihalyi Click here if your download doesn"t start automatically
Flow - der Weg zum Glück: Der Entdecker des Flow-Prinzips erklärt seine Lebensphilosophie (HERDER spektrum) (German Edition) Mihaly Csikszentmihalyi Click here if your download doesn"t start automatically
Level 2 German, 2015
 91126 911260 2SUPERVISOR S Level 2 German, 2015 91126 Demonstrate understanding of a variety of written and / or visual German text(s) on familiar matters 2.00 p.m. Friday 4 December 2015 Credits: Five
Duell auf offener Straße: Wenn sich Hunde an der Leine aggressiv verhalten (Cadmos Hundebuch) (German Edition)
 (German Edition)") Duell auf offener Straße: Wenn sich Hunde an der Leine aggressiv verhalten (Cadmos Hundebuch) (German Edition) Nadine Matthews Click here if your download doesn"t start automatically Duell auf offener
Duell auf offener Straße: Wenn sich Hunde an der Leine aggressiv verhalten (Cadmos Hundebuch) (German Edition) Nadine Matthews Click here if your download doesn"t start automatically Duell auf offener
Tote Hose: Worüber Männer schweigen. Ein Tagebuch (German Edition)
") Tote Hose: Worüber Männer schweigen. Ein Tagebuch (German Edition) Walter Raaflaub Click here if your download doesn"t start automatically Tote Hose: Worüber Männer schweigen. Ein Tagebuch (German Edition)
Tote Hose: Worüber Männer schweigen. Ein Tagebuch (German Edition) Walter Raaflaub Click here if your download doesn"t start automatically Tote Hose: Worüber Männer schweigen. Ein Tagebuch (German Edition)
Developing intercultural competences
 Developing intercultural competences Tina Lachmayr Competence Centre for Intercultural Opening and Anti-Discrimination in the Network Integration through Qualification (IQ) ; VIA Bayern e.v. 01.06.2016
Selbstbild vs. Fremdbild. Selbst- und Fremdwahrnehmung des Individuums (German Edition)
") Selbstbild vs. Fremdbild. Selbst- und Fremdwahrnehmung des Individuums (German Edition) Jasmin Nowak Click here if your download doesn"t start automatically Selbstbild vs. Fremdbild. Selbst- und Fremdwahrnehmung
Selbstbild vs. Fremdbild. Selbst- und Fremdwahrnehmung des Individuums (German Edition) Jasmin Nowak Click here if your download doesn"t start automatically Selbstbild vs. Fremdbild. Selbst- und Fremdwahrnehmung
Martin Luther. Click here if your download doesn"t start automatically
 Die schönsten Kirchenlieder von Luther (Vollständige Ausgabe): Gesammelte Gedichte: Ach Gott, vom Himmel sieh darein + Nun bitten wir den Heiligen Geist... der Unweisen Mund... (German Edition) Martin
Aus FanLiebe zu Tokio Hotel: von Fans fã¼r Fans und ihre Band
 Aus FanLiebe zu Tokio Hotel: von Fans fã¼r Fans und ihre Band Click here if your download doesn"t start automatically Aus FanLiebe zu Tokio Hotel: von Fans fã¼r Fans und ihre Band Aus FanLiebe zu Tokio
»Diesel-Verkaufspreise in Europa September 2017
 »Diesel-Verkaufspreise in Europa Netto Preise net prices Durchschnittspreise auf Basis der DKV Transaktionen / Average prices based on DKV transactions Alle Angaben ohne Gewähr / All information without
»Diesel-Verkaufspreise in Europa Juli - July 2017
 »Diesel-Verkaufspreise in Europa Netto Preise net prices Durchschnittspreise auf Basis der DKV Transaktionen / Average prices based on DKV transactions Alle Angaben ohne Gewähr / All information without
»Diesel-Verkaufspreise in Europa Juni - June 2017
 »Diesel-Verkaufspreise in Europa Netto Preise net prices Durchschnittspreise auf Basis der DKV Transaktionen / Average prices based on DKV transactions Alle Angaben ohne Gewähr / All information without
»Diesel-Verkaufspreise in Europa Oktober - October 2017
 »Diesel-Verkaufspreise in Europa Netto Preise net prices Durchschnittspreise auf Basis der DKV Transaktionen / Average prices based on DKV transactions Alle Angaben ohne Gewähr / All information without
Big Data Analytics. Fifth Munich Data Protection Day, March 23, Dr. Stefan Krätschmer, Data Privacy Officer, Europe, IBM
 Big Data Analytics Fifth Munich Data Protection Day, March 23, 2017 C Dr. Stefan Krätschmer, Data Privacy Officer, Europe, IBM Big Data Use Cases Customer focused - Targeted advertising / banners - Analysis
»Diesel-Verkaufspreise in Europa Mai - May 2017
 »Diesel-Verkaufspreise in Europa Netto Preise net prices Durchschnittspreise auf Basis der DKV Transaktionen / Average prices based on DKV transactions Alle Angaben ohne Gewähr / All information without
Ab 40 reif für den Traumjob!: Selbstbewusstseins- Training Für Frauen, Die Es Noch Mal Wissen Wollen (German Edition)
") Ab 40 reif für den Traumjob!: Selbstbewusstseins- Training Für Frauen, Die Es Noch Mal Wissen Wollen (German Edition) Anja Kolberg Click here if your download doesn"t start automatically Ab 40 reif für
Ab 40 reif für den Traumjob!: Selbstbewusstseins- Training Für Frauen, Die Es Noch Mal Wissen Wollen (German Edition) Anja Kolberg Click here if your download doesn"t start automatically Ab 40 reif für
FAHRZEUGENTWICKLUNG IM AUTOMOBILBAU FROM HANSER FACHBUCHVERLAG DOWNLOAD EBOOK : FAHRZEUGENTWICKLUNG IM AUTOMOBILBAU FROM HANSER FACHBUCHVERLAG PDF
 Read Online and Download Ebook FAHRZEUGENTWICKLUNG IM AUTOMOBILBAU FROM HANSER FACHBUCHVERLAG DOWNLOAD EBOOK : FAHRZEUGENTWICKLUNG IM AUTOMOBILBAU FROM Click link bellow and free register to download ebook:
»Diesel-Verkaufspreise in Europa November 2017
 »Diesel-Verkaufspreise in Europa Netto Preise net prices Durchschnittspreise auf Basis der DKV Transaktionen / Average prices based on DKV transactions Alle Angaben ohne Gewähr / All information without
»Diesel-Verkaufspreise in Europa März - March 2018
 »Diesel-Verkaufspreise in Europa Netto Preise net prices Durchschnittspreise auf Basis der DKV Transaktionen / Average prices based on DKV transactions Alle Angaben ohne Gewähr / All information without
»Diesel-Verkaufspreise in Europa Februar - February 2018
 »Diesel-Verkaufspreise in Europa Netto Preise net prices Durchschnittspreise auf Basis der DKV Transaktionen / Average prices based on DKV transactions Alle Angaben ohne Gewähr / All information without
Jägersprache, Wildkunde und Begriffe aus der Jagd: Schwerpunkt Jägerprüfung Rotwild, Rehwild, Gamswild, Steinwild, Muffelwild (German Edition)
") Jägersprache, Wildkunde und Begriffe aus der Jagd: Schwerpunkt Jägerprüfung Rotwild, Rehwild, Gamswild, Steinwild, Muffelwild (German Edition) Ernst Jäger Click here if your download doesn"t start automatically
Jägersprache, Wildkunde und Begriffe aus der Jagd: Schwerpunkt Jägerprüfung Rotwild, Rehwild, Gamswild, Steinwild, Muffelwild (German Edition) Ernst Jäger Click here if your download doesn"t start automatically
Star Trek: die Serien, die Filme, die Darsteller: Interessante Infod, zusammengestellt aus Wikipedia-Seiten (German Edition)
") Star Trek: die Serien, die Filme, die Darsteller: Interessante Infod, zusammengestellt aus Wikipedia-Seiten (German Edition) Doktor Googelberg Click here if your download doesn"t start automatically Star
Star Trek: die Serien, die Filme, die Darsteller: Interessante Infod, zusammengestellt aus Wikipedia-Seiten (German Edition) Doktor Googelberg Click here if your download doesn"t start automatically Star
Finanzierung betriebsspezifischer vs. allgemeiner Qualifizierung
 4.4.2 (1) Finanzierung betriebsspezifischer vs. allgemeiner Qualifizierung Expected annual earnings Post-training level of output D A 1 X 3 B G 2 E C Marginal product in job B Marginal product in job A
Ausführliche Unterrichtsvorbereitung: Der tropische Regenwald und seine Bedeutung als wichtiger Natur- und Lebensraum (German Edition)
") Ausführliche Unterrichtsvorbereitung: Der tropische Regenwald und seine Bedeutung als wichtiger Natur- und Lebensraum (German Edition) Sebastian Gräf Click here if your download doesn"t start automatically
Ausführliche Unterrichtsvorbereitung: Der tropische Regenwald und seine Bedeutung als wichtiger Natur- und Lebensraum (German Edition) Sebastian Gräf Click here if your download doesn"t start automatically
ELEKTRONISCHES TESTARCHIV
 Leibniz Zentrum für Psychologische Information und Dokumentation (ZPID) ELEKTRONISCHES TESTARCHIV Testverfahren aus dem Elektronischen Testarchiv Liebe Nutzerinnen und liebe Nutzer, wir freuen uns, dass
Körpersprache im Beruf für Dummies (German Edition)
") Körpersprache im Beruf für Dummies (German Edition) Elizabeth Kuhnke Click here if your download doesn"t start automatically Körpersprache im Beruf für Dummies (German Edition) Elizabeth Kuhnke Körpersprache
Körpersprache im Beruf für Dummies (German Edition) Elizabeth Kuhnke Click here if your download doesn"t start automatically Körpersprache im Beruf für Dummies (German Edition) Elizabeth Kuhnke Körpersprache
"Die Bundesländer Deutschlands und deren Hauptstädte" als Thema einer Unterrichtsstunde für eine 5. Klasse (German Edition)
") "Die Bundesländer Deutschlands und deren Hauptstädte" als Thema einer Unterrichtsstunde für eine 5. Klasse (German Edition) Florian Schwarze Click here if your download doesn"t start automatically Download
"Die Bundesländer Deutschlands und deren Hauptstädte" als Thema einer Unterrichtsstunde für eine 5. Klasse (German Edition) Florian Schwarze Click here if your download doesn"t start automatically Download
Kursbuch Naturheilverfahren: Curriculum der Weiterbildung zur Erlangung der Zusatzbezeichnung Naturheilverfahren (German Edition)
") Kursbuch Naturheilverfahren: Curriculum der Weiterbildung zur Erlangung der Zusatzbezeichnung Naturheilverfahren (German Edition) Click here if your download doesn"t start automatically Kursbuch Naturheilverfahren:
Kursbuch Naturheilverfahren: Curriculum der Weiterbildung zur Erlangung der Zusatzbezeichnung Naturheilverfahren (German Edition) Click here if your download doesn"t start automatically Kursbuch Naturheilverfahren:
Handbuch der therapeutischen Seelsorge: Die Seelsorge-Praxis / Gesprächsführung in der Seelsorge (German Edition)
") Handbuch der therapeutischen Seelsorge: Die Seelsorge-Praxis / Gesprächsführung in der Seelsorge (German Edition) Reinhold Ruthe Click here if your download doesn"t start automatically Handbuch der therapeutischen
Handbuch der therapeutischen Seelsorge: Die Seelsorge-Praxis / Gesprächsführung in der Seelsorge (German Edition) Reinhold Ruthe Click here if your download doesn"t start automatically Handbuch der therapeutischen
EVANGELISCHES GESANGBUCH: AUSGABE FUR DIE EVANGELISCH-LUTHERISCHE LANDESKIRCHE SACHSEN. BLAU (GERMAN EDITION) FROM EVANGELISCHE VERLAGSAN
 FROM EVANGELISCHE VERLAGSAN") EVANGELISCHES GESANGBUCH: AUSGABE FUR DIE EVANGELISCH-LUTHERISCHE LANDESKIRCHE SACHSEN. BLAU (GERMAN EDITION) FROM EVANGELISCHE VERLAGSAN DOWNLOAD EBOOK : EVANGELISCHES GESANGBUCH: AUSGABE FUR DIE EVANGELISCH-LUTHERISCHE
EVANGELISCHES GESANGBUCH: AUSGABE FUR DIE EVANGELISCH-LUTHERISCHE LANDESKIRCHE SACHSEN. BLAU (GERMAN EDITION) FROM EVANGELISCHE VERLAGSAN DOWNLOAD EBOOK : EVANGELISCHES GESANGBUCH: AUSGABE FUR DIE EVANGELISCH-LUTHERISCHE
Willy Pastor. Click here if your download doesn"t start automatically
 Albrecht Dürer - Der Mann und das Werk (Vollständige Biografie mit 50 Bildern): Das Leben Albrecht Dürers, eines bedeutenden Künstler (Maler, Grafiker... und der Reformation (German Edition) Willy Pastor
Notruf 112: Kommission fordert Mehrsprachigkeit für einheitlichen europäischen Notruf
 IP/09/40 Brüssel, 11. Februar 009 Notruf 11: Kommission fordert Mehrsprachigkeit für einheitlichen europäischen Notruf Seit Dezember 008 erreichen die EU-Bürger die Notrufdienste aus allen Fest- und Mobilfunknetzen
Privatverkauf von Immobilien - Erfolgreich ohne Makler (German Edition)
") Privatverkauf von Immobilien - Erfolgreich ohne Makler (German Edition) Edgar Freiherr Click here if your download doesn"t start automatically Privatverkauf von Immobilien - Erfolgreich ohne Makler (German
Privatverkauf von Immobilien - Erfolgreich ohne Makler (German Edition) Edgar Freiherr Click here if your download doesn"t start automatically Privatverkauf von Immobilien - Erfolgreich ohne Makler (German
Schöpfung als Thema des Religionsunterrichts in der Sekundarstufe II (German Edition)
") Schöpfung als Thema des Religionsunterrichts in der Sekundarstufe II (German Edition) Juliane Timmroth Click here if your download doesn"t start automatically Schöpfung als Thema des Religionsunterrichts
Schöpfung als Thema des Religionsunterrichts in der Sekundarstufe II (German Edition) Juliane Timmroth Click here if your download doesn"t start automatically Schöpfung als Thema des Religionsunterrichts
Volksgenossinnen: Frauen in der NS- Volksgemeinschaft (Beiträge zur Geschichte des Nationalsozialismus) (German Edition)
 (German Edition)") Volksgenossinnen: Frauen in der NS- Volksgemeinschaft (Beiträge zur Geschichte des Nationalsozialismus) (German Edition) Hg. von Sybille Steinbacher Click here if your download doesn"t start automatically
Volksgenossinnen: Frauen in der NS- Volksgemeinschaft (Beiträge zur Geschichte des Nationalsozialismus) (German Edition) Hg. von Sybille Steinbacher Click here if your download doesn"t start automatically
There are 10 weeks this summer vacation the weeks beginning: June 23, June 30, July 7, July 14, July 21, Jul 28, Aug 4, Aug 11, Aug 18, Aug 25
 Name: AP Deutsch Sommerpaket 2014 The AP German exam is designed to test your language proficiency your ability to use the German language to speak, listen, read and write. All the grammar concepts and
VORANSICHT. Halloween zählt zu den beliebtesten. A spooky and special holiday Eine Lerntheke zu Halloween auf zwei Niveaus (Klassen 8/9)
") IV Exploringlifeandculture 12 Halloween(Kl.8/9) 1 von28 A spooky and special holiday Eine Lerntheke zu Halloween auf zwei Niveaus (Klassen 8/9) EinBeitragvonKonstanzeZander,Westerengel Halloween zählt
IV Exploringlifeandculture 12 Halloween(Kl.8/9) 1 von28 A spooky and special holiday Eine Lerntheke zu Halloween auf zwei Niveaus (Klassen 8/9) EinBeitragvonKonstanzeZander,Westerengel Halloween zählt
Fußballtraining für jeden Tag: Die 365 besten Übungen (German Edition)
") Fußballtraining für jeden Tag: Die 365 besten Übungen (German Edition) Frank Thömmes Click here if your download doesn"t start automatically Fußballtraining für jeden Tag: Die 365 besten Übungen (German
Fußballtraining für jeden Tag: Die 365 besten Übungen (German Edition) Frank Thömmes Click here if your download doesn"t start automatically Fußballtraining für jeden Tag: Die 365 besten Übungen (German
Im Zeichen der Sonne: Schamanische Heilrituale (German Edition)
") Im Zeichen der Sonne: Schamanische Heilrituale (German Edition) Click here if your download doesn"t start automatically Im Zeichen der Sonne: Schamanische Heilrituale (German Edition) Im Zeichen der Sonne:
Im Zeichen der Sonne: Schamanische Heilrituale (German Edition) Click here if your download doesn"t start automatically Im Zeichen der Sonne: Schamanische Heilrituale (German Edition) Im Zeichen der Sonne:
Das Zeitalter der Fünf 3: Götter (German Edition)
") Das Zeitalter der Fünf 3: Götter (German Edition) Trudi Canavan Click here if your download doesn"t start automatically Das Zeitalter der Fünf 3: Götter (German Edition) Trudi Canavan Das Zeitalter der
Das Zeitalter der Fünf 3: Götter (German Edition) Trudi Canavan Click here if your download doesn"t start automatically Das Zeitalter der Fünf 3: Götter (German Edition) Trudi Canavan Das Zeitalter der
Klimahysterie - was ist dran?: Der neue Nairobi- Report über Klimawandel, Klimaschwindel und Klimawahn (German Edition)
") Klimahysterie - was ist dran?: Der neue Nairobi- Report über Klimawandel, Klimaschwindel und Klimawahn (German Edition) Michael Limburg Click here if your download doesn"t start automatically Klimahysterie
Klimahysterie - was ist dran?: Der neue Nairobi- Report über Klimawandel, Klimaschwindel und Klimawahn (German Edition) Michael Limburg Click here if your download doesn"t start automatically Klimahysterie
Die gesunde Schilddrüse: Was Sie unbedingt wissen sollten über Gewichtsprobleme, Depressionen, Haarausfall und andere Beschwerden (German Edition)
") Die gesunde Schilddrüse: Was Sie unbedingt wissen sollten über Gewichtsprobleme, Depressionen, Haarausfall und andere Beschwerden (German Edition) Mary J. Shomon Click here if your download doesn"t start
Die gesunde Schilddrüse: Was Sie unbedingt wissen sollten über Gewichtsprobleme, Depressionen, Haarausfall und andere Beschwerden (German Edition) Mary J. Shomon Click here if your download doesn"t start
Slide 3: How to translate must not and needn t with two sentences to illustrate this.
 Teaching notes This resource is designed to revise the use of modal verbs in the present tense and includes a starter card sort, PowerPoint presentation and Word worksheet. Suggested starter activities
Fachübersetzen - Ein Lehrbuch für Theorie und Praxis
 Fachübersetzen - Ein Lehrbuch für Theorie und Praxis Radegundis Stolze Click here if your download doesn"t start automatically Fachübersetzen - Ein Lehrbuch für Theorie und Praxis Radegundis Stolze Fachübersetzen
Where are we now? The administration building M 3. Voransicht
 Let me show you around 9 von 26 Where are we now? The administration building M 3 12 von 26 Let me show you around Presenting your company 2 I M 5 Prepositions of place and movement There are many prepositions
Top-Antworten im Bewerbungsgespräch für Dummies (German Edition)
") Top-Antworten im Bewerbungsgespräch für Dummies (German Edition) Rob Yeung Click here if your download doesn"t start automatically Top-Antworten im Bewerbungsgespräch für Dummies (German Edition) Rob Yeung
Top-Antworten im Bewerbungsgespräch für Dummies (German Edition) Rob Yeung Click here if your download doesn"t start automatically Top-Antworten im Bewerbungsgespräch für Dummies (German Edition) Rob Yeung
Nießbrauch- und Wohnrechtsverträge richtig abschließen (German Edition)
") Nießbrauch- und Wohnrechtsverträge richtig abschließen (German Edition) Akademische Arbeitsgemeinschaft Verlag Click here if your download doesn"t start automatically Nießbrauch- und Wohnrechtsverträge
Nießbrauch- und Wohnrechtsverträge richtig abschließen (German Edition) Akademische Arbeitsgemeinschaft Verlag Click here if your download doesn"t start automatically Nießbrauch- und Wohnrechtsverträge
Level 1 German, 2012
 90886 908860 1SUPERVISOR S Level 1 German, 2012 90886 Demonstrate understanding of a variety of German texts on areas of most immediate relevance 9.30 am Tuesday 13 November 2012 Credits: Five Achievement
Gott, Jesus, Bibel?: Fragen und Antworten (German Edition)
") Gott, Jesus, Bibel?: Fragen und Antworten (German Edition) Jörg Bauer Click here if your download doesn"t start automatically Gott, Jesus, Bibel?: Fragen und Antworten (German Edition) Jörg Bauer Gott,
Gott, Jesus, Bibel?: Fragen und Antworten (German Edition) Jörg Bauer Click here if your download doesn"t start automatically Gott, Jesus, Bibel?: Fragen und Antworten (German Edition) Jörg Bauer Gott,
Methoden der empirischen Kommunikationsforschung: Eine Einführung (Studienbücher zur Kommunikations- und Medienwissenschaft) (German Edition)
 (German Edition)") Methoden der empirischen Kommunikationsforschung: Eine Einführung (Studienbücher zur Kommunikations- und Medienwissenschaft) (German Edition) Click here if your download doesn"t start automatically Methoden
Methoden der empirischen Kommunikationsforschung: Eine Einführung (Studienbücher zur Kommunikations- und Medienwissenschaft) (German Edition) Click here if your download doesn"t start automatically Methoden
Security of Pensions
 Security of Pensions by Prof. Dr. Heinz-Dietrich Steinmeyer - Pensions are of essential importance for people and security of pensions important for them for a number of reasons - People depend on pensions
2015 Annual General Assembly of Members on Friday, 18 September 2015, 17:00 to 20:00 hours at Coaching Institut Berlin, Waldstr.
 Berlin and Seefeld, 20 August 2015 Dear EASC colleague, We warmly invite you to this year s of Members on Friday, 18 September 2015, 17:00 to 20:00 hours at Coaching Institut Berlin, Waldstr. 32, 10551
Microsoft SQL Server Überblick über Konfiguration, Administration, Programmierung (German Edition)
") Microsoft SQL Server 2012 - Überblick über Konfiguration, Administration, Programmierung (German Edition) Markus Raatz, Jörg Knuth, Ruprecht Dröge Click here if your download doesn"t start automatically
Microsoft SQL Server 2012 - Überblick über Konfiguration, Administration, Programmierung (German Edition) Markus Raatz, Jörg Knuth, Ruprecht Dröge Click here if your download doesn"t start automatically
Lehrstuhl für Allgemeine BWL Strategisches und Internationales Management Prof. Dr. Mike Geppert Carl-Zeiß-Str. 3 07743 Jena
 Lehrstuhl für Allgemeine BWL Strategisches und Internationales Management Prof. Dr. Mike Geppert Carl-Zeiß-Str. 3 07743 Jena http://www.im.uni-jena.de Contents I. Learning Objectives II. III. IV. Recap
Registration of residence at Citizens Office (Bürgerbüro)
") Registration of residence at Citizens Office (Bürgerbüro) Opening times in the Citizens Office (Bürgerbüro): Monday to Friday 08.30 am 12.30 pm Thursday 14.00 pm 17.00 pm or by appointment via the Citizens
Registration of residence at Citizens Office (Bürgerbüro) Opening times in the Citizens Office (Bürgerbüro): Monday to Friday 08.30 am 12.30 pm Thursday 14.00 pm 17.00 pm or by appointment via the Citizens
Mathematik für Wirtschaftswissenschaftler: Basiswissen mit Praxisbezug (Pearson Studium - Economic BWL) (German Edition)
 (German Edition)") Mathematik für Wirtschaftswissenschaftler: Basiswissen mit Praxisbezug (Pearson Studium - Economic BWL) (German Edition) Knut Sydsaeter, Peter Hammond Click here if your download doesn"t start automatically
Mathematik für Wirtschaftswissenschaftler: Basiswissen mit Praxisbezug (Pearson Studium - Economic BWL) (German Edition) Knut Sydsaeter, Peter Hammond Click here if your download doesn"t start automatically
PONS DIE DREI??? FRAGEZEICHEN, ARCTIC ADVENTURE: ENGLISCH LERNEN MIT JUSTUS, PETER UND BOB
 Read Online and Download Ebook PONS DIE DREI??? FRAGEZEICHEN, ARCTIC ADVENTURE: ENGLISCH LERNEN MIT JUSTUS, PETER UND BOB DOWNLOAD EBOOK : PONS DIE DREI??? FRAGEZEICHEN, ARCTIC ADVENTURE: Click link bellow
Konkret - der Ratgeber: Die besten Tipps zu Internet, Handy und Co. (German Edition)
") Konkret - der Ratgeber: Die besten Tipps zu Internet, Handy und Co. (German Edition) Kenny Lang, Marvin Wolf, Elke Weiss Click here if your download doesn"t start automatically Konkret - der Ratgeber:
Konkret - der Ratgeber: Die besten Tipps zu Internet, Handy und Co. (German Edition) Kenny Lang, Marvin Wolf, Elke Weiss Click here if your download doesn"t start automatically Konkret - der Ratgeber:
Berlin Demography Forum, March 18-20, Demography Compass
 Berlin Demography Forum, March 18-20, 2015 Demography Compass In addition to the panel discussions, the Berlin Demography Forum wants to contribute some original insights. It has developed a set of indicators
Non users after Cochlear Implantation in Single Sided Deafness
 Non users after Cochlear Implantation in Single Sided Deafness W. Pethe*, J. Langer*, S. Lissel**, K. Begall* *HNO-Klinik, AMEOS Klinikum Halberstadt **Cochlear Implant Rehabilitationszentrum Sachsen-Anhalt
Reparaturen kompakt - Küche + Bad: Waschbecken, Fliesen, Spüle, Armaturen, Dunstabzugshaube... (German Edition)
") Reparaturen kompakt - Küche + Bad: Waschbecken, Fliesen, Spüle, Armaturen, Dunstabzugshaube... (German Edition) Peter Birkholz, Michael Bruns, Karl-Gerhard Haas, Hans-Jürgen Reinbold Click here if your
Reparaturen kompakt - Küche + Bad: Waschbecken, Fliesen, Spüle, Armaturen, Dunstabzugshaube... (German Edition) Peter Birkholz, Michael Bruns, Karl-Gerhard Haas, Hans-Jürgen Reinbold Click here if your
Open Source und Workflow im Unternehmen: Eine Untersuchung von Processmaker, Joget, Bonita Open Solution, uengine und Activiti (German Edition)
") Open Source und Workflow im Unternehmen: Eine Untersuchung von Processmaker, Joget, Bonita Open Solution, uengine und Activiti (German Edition) Oliver Königs Click here if your download doesn"t start automatically
Open Source und Workflow im Unternehmen: Eine Untersuchung von Processmaker, Joget, Bonita Open Solution, uengine und Activiti (German Edition) Oliver Königs Click here if your download doesn"t start automatically
Einsatz einer Dokumentenverwaltungslösung zur Optimierung der unternehmensübergreifenden Kommunikation
 Einsatz einer Dokumentenverwaltungslösung zur Optimierung der unternehmensübergreifenden Kommunikation Eine Betrachtung im Kontext der Ausgliederung von Chrysler Daniel Rheinbay Abstract Betriebliche Informationssysteme